
Page 383 - Demo
P. 383
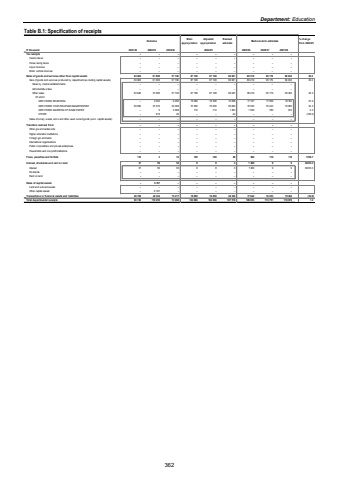
Department: EducationTable B.1: Specification of receipts Outcome Main appropriationAdjusted appropriationRevised estimate Medium-term estimates % change from 2024/25R thousand 2021/22 2022/23 2023/24 2025/26 2026/27 2027/28Tax receipts %u2013 %u2013 %u2013 %u2013 %u2013 %u2013 %u2013 %u2013 %u2013 Casino tax es %u2013 %u2013 %u2013 %u2013 %u2013 %u2013 %u2013 %u2013 %u2013 Horse racing tax es %u2013 %u2013 %u2013 %u2013 %u2013 %u2013 %u2013 %u2013 %u2013 Liquor licences %u2013 %u2013 %u2013 %u2013 %u2013 %u2013 %u2013 %u2013 %u2013 Motor v ehicle licences %u2013 %u2013 %u2013 %u2013 %u2013 %u2013 %u2013 %u2013 %u2013 Sales of goods and services other than capital assets 63 826 61 690 57 746 87 108 87 108 69 081 89 219 95 179 99 462 29.2Sale of goods and serv ices produced by department (ex cluding capital assets) 63 826 61 690 57 746 87 108 87 108 69 081 89 219 95 179 99 462 29.2Sales by market establishments %u2013 %u2013 %u2013 %u2013 %u2013 %u2013 %u2013 %u2013 %u2013 Administrativ e fees %u2013 %u2013 %u2013 %u2013 %u2013 %u2013 %u2013 %u2013 %u2013Other sales 63 826 61 690 57 746 87 108 87 108 69 081 89 219 95 179 99 462 29.2Of whichSERV REND BOARDING %u2013 4 653 6 290 16 396 16 396 10 895 17 167 17 956 18 764 57.6SERV REND COM INSURANCE&GARNISHEE 63 826 61 579 49 368 70 000 70 000 56 699 70 552 76 443 79 883 24.4SERV REND MARKING OF EXAM PAPER %u2013 9 2 068 712 712 1 463 1 500 780 815 2.5OTHER %u2013 619 20 %u2013 %u2013 24 %u2013 %u2013 %u2013 (100.0)Sales of scrap, w aste, arms and other used current goods (ex cl. capital assets) %u2013 %u2013 %u2013 %u2013 %u2013 %u2013 %u2013 %u2013 %u2013Transfers received from: %u2013 %u2013 %u2013 %u2013 %u2013 %u2013 %u2013 %u2013 %u2013Other gov ernmental units %u2013 %u2013 %u2013 %u2013 %u2013 %u2013 %u2013 %u2013 %u2013Higher education institutions %u2013 %u2013 %u2013 %u2013 %u2013 %u2013 %u2013 %u2013 %u2013Foreign gov ernments %u2013 %u2013 %u2013 %u2013 %u2013 %u2013 %u2013 %u2013 %u2013International organisations %u2013 %u2013 %u2013 %u2013 %u2013 %u2013 %u2013 %u2013 %u2013Public corporations and priv ate enterprises %u2013 %u2013 %u2013 %u2013 %u2013 %u2013 %u2013 %u2013 %u2013Households and non-profit institutions %u2013 %u2013 %u2013 %u2013 %u2013 %u2013 %u2013 %u2013 %u2013Fines, penalties and forfeits 110 3 72 100 100 68 992 110 115 1356.7Interest, dividends and rent on land 37 56 53 8 8 3 1 000 9 33233.3 9Interest 37 56 53 8 8 3 1 000 9 33233.3 9Div idends %u2013 %u2013 %u2013 %u2013 %u2013 %u2013 %u2013 %u2013 %u2013Rent on land %u2013 %u2013 %u2013 %u2013 %u2013 %u2013 %u2013 %u2013 %u2013Sales of capital assets %u2013 6 167 %u2013 %u2013 %u2013 %u2013 %u2013 %u2013 %u2013Land and sub-soil assets %u2013 %u2013 %u2013 %u2013 %u2013 %u2013 %u2013 %u2013 %u2013Other capital assets %u2013 6 167 %u2013 %u2013 %u2013 %u2013 %u2013 %u2013 %u2013Transactions in financial assets and liabilities 26 769 42 334 15 217 16 850 16 850 38 363 17 642 18 453 19 284 (54.0)Total departmental receipts 90 742 110 250 73 088 104 066 104 066 107 516 108 853 113 751 118 870 1.22024/25362
