
Page 595 - Demo
P. 595
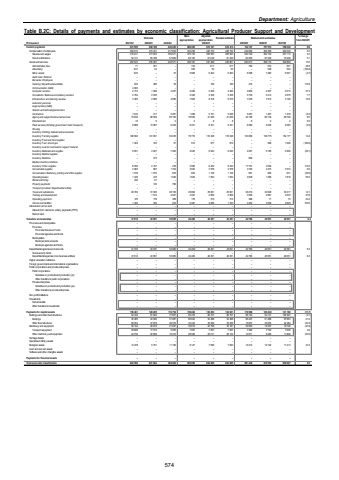
Department: AgricultureTable B.2C: Details of payments and estimates by economic classification: Agricultural Producer Support and Development Outcome Main appropriationAdjusted appropriation Revised estimate Medium-term estimates % change from 2024/25R thousand 2021/22 2022/23 2023/24 2025/26 2026/27 2027/28Current payments 631 595 649 708 640 225 668 365 674 161 672 413 732 107 757 573 769 340 8.9Compensation of employees 364 572 373 341 417 654 432 258 426 752 426 752 449 090 459 399 464 540 5.2Salaries and wages 310 431 317 633 359 971 370 155 365 503 365 503 384 740 392 154 391 112 5.3Social contributions 54 141 55 708 57 683 62 103 61 249 61 249 64 350 67 245 73 428 5.1Goods and services 267 023 276 367 222 571 236 107 247 409 245 661 283 017 298 174 304 800 15.2Administrative fees 71 451 %u2013 734 617 617 790 672 691 28.0Advertising 647 34 %u2013 520 50 50 %u2013 546 594 (100.0)Minor assets 625 %u2013 57 5 968 6 464 6 464 6 288 7 482 6 591 (2.7)Audit costs: External %u2013 %u2013 %u2013 %u2013 %u2013 %u2013 %u2013 %u2013 %u2013Bursaries: Employees %u2013 %u2013 %u2013 %u2013 %u2013 %u2013 %u2013 %u2013 %u2013Catering: Departmental activities 642 488 20 %u2013 100 100 216 %u2013 %u2013 116.0Communication (G&S) 4 822 %u2013 %u2013 %u2013 %u2013 %u2013 %u2013 %u2013 %u2013Computer services 2 774 1 288 4 207 2 200 2 200 2 200 2 800 2 407 2 515 27.3Consultants: Business and advisory services 2 704 2 539 %u2013 5 328 5 328 5 328 5 739 5 414 4 675 7.7Infrastructure and planning services 3 405 2 585 4 985 7 569 8 318 6 570 7 239 7 912 3 100 10.2Laboratory services %u2013 %u2013 %u2013 %u2013 %u2013 %u2013 %u2013 %u2013 %u2013Legal services (G&S) %u2013 %u2013 %u2013 %u2013 %u2013 %u2013 %u2013 %u2013 %u2013Science and technological services %u2013 %u2013 %u2013 %u2013 %u2013 %u2013 %u2013 %u2013 %u2013Contractors 1 545 417 2 281 1 286 5 161 5 628 5 281 1 407 1 470 (6.2)Agency and support/outsourced services 73 499 68 929 65 185 78 949 41 639 41 639 45 196 80 139 69 700 8.5Entertainment 10 6 2 2 8 8 8 2 2 0.0Fleet services (including government motor transport) 9 888 13 967 6 324 8 431 8 431 8 431 8 260 9 225 9 483 (2.0)Housing %u2013 %u2013 %u2013 %u2013 %u2013 %u2013 %u2013 %u2013 %u2013Inventory: Clothing material and accessories %u2013 %u2013 %u2013 %u2013 %u2013 %u2013 %u2013 %u2013 %u2013Inventory: Farming supplies 108 002 141 091 93 225 79 776 116 348 116 348 133 099 130 775 154 177 14.4Inventory: Food and food supplies %u2013 %u2013 %u2013 %u2013 %u2013 %u2013 %u2013 %u2013 %u2013Inventory: Fuel, oil and gas 1 404 722 57 912 977 810 %u2013 998 1 026 (100.0)Inventory: Learner and teacher support material %u2013 %u2013 %u2013 %u2013 %u2013 %u2013 %u2013 %u2013 %u2013Inventory: Materials and supplies 9 651 4 527 7 483 4 935 6 042 6 042 4 281 5 185 2 900 (29.1)Inventory: Medical supplies %u2013 %u2013 %u2013 %u2013 %u2013 %u2013 %u2013 %u2013 %u2013Inventory: Medicine %u2013 373 %u2013 %u2013 %u2013 %u2013 600 %u2013 %u2013Medsas inventory interface %u2013 %u2013 %u2013 %u2013 %u2013 %u2013 %u2013 %u2013 %u2013Inventory: Other supplies 8 930 2 197 478 2 580 8 422 8 423 17 701 2 046 %u2013 110.2Consumable supplies 2 983 987 1 764 3 022 3 578 3 578 3 793 3 473 3 574 6.0Consumables: Stationery, printing and office supplies 1 518 1 572 870 604 1 126 1 126 681 605 631 (39.5)Operating leases 1 446 416 1 540 1 620 1 954 1 954 3 038 1 268 1 818 55.5Rental and hiring 230 91 %u2013 %u2013 %u2013 %u2013 %u2013 %u2013 %u2013Property payments %u2013 145 760 %u2013 %u2013 %u2013 %u2013 %u2013 %u2013Transport provided: Departmental activity %u2013 %u2013 %u2013 %u2013 %u2013 %u2013 %u2013 %u2013 %u2013Travel and subsistence 30 782 31 520 28 195 25 884 25 601 25 601 29 219 32 628 33 417 14.1Training and development %u2013 1 514 4 527 3 222 2 669 2 669 3 946 2 881 3 533 47.8Operating payments 125 178 388 178 310 312 388 71 74 24.4Venues and facilities 1 320 330 223 2 387 2 066 1 763 4 454 3 038 4 829 152.6Interest and rent on land %u2013 %u2013 %u2013 %u2013 %u2013 %u2013 %u2013 %u2013 %u2013Interest (Incl. interest on unitary payments (PPP)) %u2013 %u2013 %u2013 %u2013 %u2013 %u2013 %u2013 %u2013 %u2013Rent on land %u2013 %u2013 %u2013 %u2013 %u2013 %u2013 %u2013 %u2013 %u2013Transfers and subsidies 31 510 43 951 53 905 42 460 40 251 40 251 42 760 40 551 40 551 6.2 Provinces and municipalities %u2013 %u2013 %u2013 %u2013 %u2013 %u2013 %u2013 %u2013 %u2013Provinces %u2013 %u2013 %u2013 %u2013 %u2013 %u2013 %u2013 %u2013 %u2013Provincial Revenue Funds %u2013 %u2013 %u2013 %u2013 %u2013 %u2013 %u2013 %u2013 %u2013Provincial agencies and funds %u2013 %u2013 %u2013 %u2013 %u2013 %u2013 %u2013 %u2013 %u2013Municipalities %u2013 %u2013 %u2013 %u2013 %u2013 %u2013 %u2013 %u2013 %u2013Municipal bank accounts %u2013 %u2013 %u2013 %u2013 %u2013 %u2013 %u2013 %u2013 %u2013Municipal agencies and funds %u2013 %u2013 %u2013 %u2013 %u2013 %u2013 %u2013 %u2013 %u2013Departmental agencies and accounts 31 510 43 951 53 905 42 460 40 251 40 251 42 760 40 551 40 551 6.2Social security funds %u2013 %u2013 %u2013 %u2013 %u2013 %u2013 %u2013 %u2013 %u2013Departmental agencies (non-business entities) 31 510 43 951 53 905 42 460 40 251 40 251 42 760 40 551 40 551 6.2Higher education institutions %u2013 %u2013 %u2013 %u2013 %u2013 %u2013 %u2013 %u2013 %u2013Foreign governments and international organisations %u2013 %u2013 %u2013 %u2013 %u2013 %u2013 %u2013 %u2013 %u2013Public corporations and private enterprises %u2013 %u2013 %u2013 %u2013 %u2013 %u2013 %u2013 %u2013 %u2013Public corporations %u2013 %u2013 %u2013 %u2013 %u2013 %u2013 %u2013 %u2013 %u2013Subsidies on products and production (pc) %u2013 %u2013 %u2013 %u2013 %u2013 %u2013 %u2013 %u2013 %u2013Other transfers to public corporations %u2013 %u2013 %u2013 %u2013 %u2013 %u2013 %u2013 %u2013 %u2013Private enterprises %u2013 %u2013 %u2013 %u2013 %u2013 %u2013 %u2013 %u2013 %u2013Subsidies on products and production (pe) %u2013 %u2013 %u2013 %u2013 %u2013 %u2013 %u2013 %u2013 %u2013Other transfers to private enterprises %u2013 %u2013 %u2013 %u2013 %u2013 %u2013 %u2013 %u2013 %u2013Non-profit institutions %u2013 %u2013 %u2013 %u2013 %u2013 %u2013 %u2013 %u2013 %u2013Households %u2013 %u2013 %u2013 %u2013 %u2013 %u2013 %u2013 %u2013 %u2013Social benefits %u2013 %u2013 %u2013 %u2013 %u2013 %u2013 %u2013 %u2013 %u2013Other transfers to households %u2013 %u2013 %u2013 %u2013 %u2013 %u2013 %u2013 %u2013 %u2013Payments for capital assets 159 461 128 205 110 754 139 240 130 253 132 001 116 569 120 430 141 106 (11.7)Buildings and other fixed structures 94 439 81 604 77 657 95 478 89 757 89 757 86 104 94 121 109 947 (4.1)Buildings 36 385 43 926 51 087 60 044 54 488 54 488 66 447 61 486 67 663 21.9Other fixed structures 58 054 37 678 26 570 35 434 35 269 35 269 19 657 32 635 42 284 (44.3)Machinery and equipment 50 744 40 810 21 937 35 615 32 798 35 181 20 053 16 207 19 746 (43.0)Transport equipment 25 988 17 910 5 565 7 057 7 057 7 057 7 382 7 722 7 938 4.6Other machinery and equipment 24 756 22 900 16 372 28 558 25 741 28 124 12 671 8 485 11 808 (54.9)Heritage Assets %u2013 %u2013 %u2013 %u2013 %u2013 %u2013 %u2013 %u2013 %u2013Specialised military assets %u2013 %u2013 %u2013 %u2013 %u2013 %u2013 %u2013 %u2013 %u2013Biological assets 14 278 5 791 11 160 8 147 7 698 7 063 10 412 10 102 11 413 47.4Land and sub-soil assets %u2013 %u2013 %u2013 %u2013 %u2013 %u2013 %u2013 %u2013 %u2013Software and other intangible assets %u2013 %u2013 %u2013 %u2013 %u2013 %u2013 %u2013 %u2013 %u2013Payments for financial assets %u2013 %u2013 %u2013 %u2013 %u2013 %u2013 %u2013 %u2013 %u2013Total economic classification 822 566 821 864 804 884 850 065 844 665 844 665 891 436 918 554 950 997 5.52024/25574
