
Page 700 - Demo
P. 700
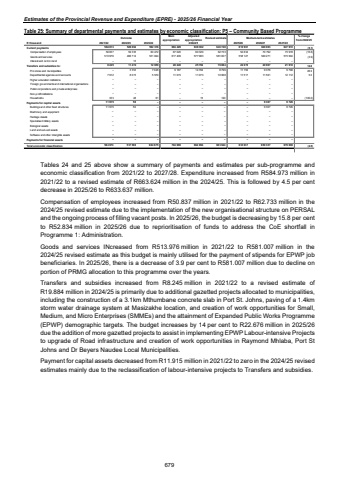
Estimates of the Provincial Revenue and Expenditure (EPRE) - 2025/26 Financial YearTable 25: Summary of departmental payments and estimates by economic classification: P5 %u2013 Community Based Programme Outcome Main appropriationAdjusted appropriation Revised estimate Medium-term estimates % change from 2024/25R thousand 2021/22 2022/23 2023/24 2025/26 2026/27 2027/28Current payments 526 062 564 813 592 316 684 429 638 302 643 740 610 961 620 063 647 972 (5.1)Compensation of employees 50 837 59 335 60 472 67 020 60 320 62 733 52 834 70 792 73 978 (15.8)Goods and services 513 976 466 714 531 844 617 409 577 983 581 007 558 127 549 271 573 994 (3.9)Interest and rent on land %u2013 13 %u2013 %u2013 %u2013 %u2013 %u2013 %u2013 %u2013Transfers and subsidies to: 8 245 11 474 12 659 20 240 25 792 19 884 22 676 20 967 21 910 14.0Provinces and municipalities %u2013 3 353 7 028 9 167 14 704 8 796 11 159 9 376 9 798 26.9Departmental agencies and accounts 7 912 8 073 5 570 11 073 11 073 10 968 11 517 11 591 12 112 5.0Higher education institutions %u2013 %u2013 %u2013 %u2013 %u2013 %u2013 %u2013 %u2013 %u2013Foreign governments and international organisations %u2013 %u2013 %u2013 %u2013 %u2013 %u2013 %u2013 %u2013 %u2013Public corporations and private enterprises %u2013 %u2013 %u2013 %u2013 %u2013 %u2013 %u2013 %u2013 %u2013Non-profit institutions %u2013 %u2013 %u2013 %u2013 %u2013 %u2013 %u2013 %u2013 %u2013Households 333 48 61 %u2013 15 120 %u2013 %u2013 %u2013 (100.0)Payments for capital assets 11 915 50 %u2013 %u2013 %u2013 %u2013 %u2013 9 307 9 726Buildings and other fixed structures 11 915 50 %u2013 %u2013 %u2013 %u2013 %u2013 9 307 9 726Machinery and equipment %u2013 %u2013 %u2013 %u2013 %u2013 %u2013 %u2013 %u2013 %u2013Heritage Assets %u2013 %u2013 %u2013 %u2013 %u2013 %u2013 %u2013 %u2013 %u2013Specialised military assets %u2013 %u2013 %u2013 %u2013 %u2013 %u2013 %u2013 %u2013 %u2013Biological assets %u2013 %u2013 %u2013 %u2013 %u2013 %u2013 %u2013 %u2013 %u2013Land and sub-soil assets %u2013 %u2013 %u2013 %u2013 %u2013 %u2013 %u2013 %u2013 %u2013Software and other intangible assets %u2013 %u2013 %u2013 %u2013 %u2013 %u2013 %u2013 %u2013 %u2013Payments for financial assets %u2013 %u2013 %u2013 %u2013 %u2013 %u2013 %u2013 %u2013 %u2013Total economic classification 584 973 537 586 604 975 704 669 664 094 663 624 633 637 650 337 679 608 (4.5)2024/25Tables 24 and 25 above show a summary of payments and estimates per sub-programme and economic classification from 2021/22 to 2027/28. Expenditure increased from R584.973 million in 2021/22 to a revised estimate of R663.624 million in the 2024/25. This is followed by 4.5 per cent decrease in 2025/26 to R633.637 million. Compensation of employees increased from R50.837 million in 2021/22 to R62.733 million in the 2024/25 revised estimate due to the implementation of the new organisational structure on PERSAL and the ongoing process of filling vacant posts. In 2025/26, the budget is decreasing by 15.8 per cent to R52.834 million in 2025/26 due to reprioritisation of funds to address the CoE shortfall in Programme 1: Administration. Goods and services INcreased from R513.976 million in 2021/22 to R581.007 million in the 2024/25 revised estimate as this budget is mainly utilised for the payment of stipends for EPWP job beneficiaries. In 2025/26, there is a decrease of 3.9 per cent to R581.007 million due to decline on portion of PRMG allocation to this programme over the years. Transfers and subsidies increased from R8.245 million in 2021/22 to a revised estimate of R19.884 million in 2024/25 is primarily due to additional gazetted projects allocated to municipalities, including the construction of a 3.1km Mthumbane concrete slab in Port St. Johns, paving of a 1.4km storm water drainage system at Masizakhe location, and creation of work opportunities for Small, Medium, and Micro Enterprises (SMMEs) and the attainment of Expanded Public Works Programme (EPWP) demographic targets. The budget increases by 14 per cent to R22.676 million in 2025/26 due the addition of more gazetted projects to assist in implementing EPWP Labour-intensive Projects to upgrade of Road infrastructure and creation of work opportunities in Raymond Mhlaba, Port St Johns and Dr Beyers Naudee Local Municipalities. Payment for capital assets decreased from R11.915 million in 2021/22 to zero in the 2024/25 revised estimates mainly due to the reclassification of labour-intensive projects to Transfers and subsidies. 679
