
Page 704 - Demo
P. 704
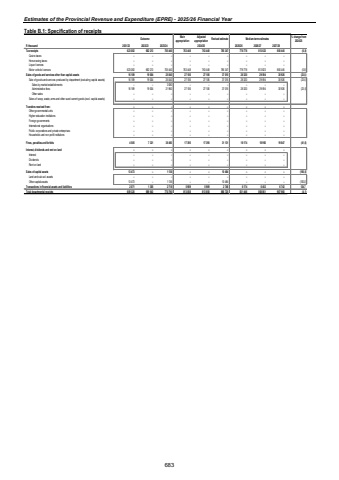
Estimates of the Provincial Revenue and Expenditure (EPRE) - 2025/26 Financial YearTable B.1: Specification of receipts Outcome Main appropriationAdjusted appropriation Revised estimate Medium-term estimates % change from 2024/25R thousand 2021/22 2022/23 2023/24 2025/26 2026/27 2027/28Tax receipts 623 082 662 213 705 440 763 448 763 448 785 347 778 778 813 823 850 445 (0,8)Casino taxes %u2013 %u2013 %u2013 %u2013 %u2013 %u2013 %u2013 %u2013 %u2013Horse racing taxes %u2013 %u2013 %u2013 %u2013 %u2013 %u2013 %u2013 %u2013 %u2013Liquor licences %u2013 %u2013 %u2013 %u2013 %u2013 %u2013 %u2013 %u2013 %u2013Motor vehicle licences 623 082 662 213 705 440 763 448 763 448 785 347 778 778 813 823 850 445 (0,8)Sales of goods and services other than capital assets 16 189 19 004 25 040 27 106 27 106 37 015 28 320 29 594 30 926 (23,5)Sale of goods and services produced by department (excluding capital assets) 16 189 19 004 25 040 27 106 27 106 37 015 28 320 29 594 30 926 (23,5)Sales by market establishments %u2013 %u2013 3 080 %u2013 %u2013 %u2013 %u2013 %u2013 %u2013Administrative fees 16 189 19 004 21 960 27 106 27 106 37 015 28 320 29 594 30 926 (23,5)Other sales %u2013 %u2013 %u2013 %u2013 %u2013 %u2013 %u2013 %u2013 %u2013Sales of scrap, waste, arms and other used current goods (excl. capital assets) %u2013 %u2013 %u2013 %u2013 %u2013 %u2013 %u2013 %u2013 %u2013Transfers received from: %u2013 %u2013 %u2013 %u2013 %u2013 %u2013 %u2013 %u2013 %u2013Other governmental units %u2013 %u2013 %u2013 %u2013 %u2013 %u2013 %u2013 %u2013 %u2013Higher education institutions %u2013 %u2013 %u2013 %u2013 %u2013 %u2013 %u2013 %u2013 %u2013Foreign governments %u2013 %u2013 %u2013 %u2013 %u2013 %u2013 %u2013 %u2013 %u2013International organisations %u2013 %u2013 %u2013 %u2013 %u2013 %u2013 %u2013 %u2013 %u2013Public corporations and private enterprises %u2013 %u2013 %u2013 %u2013 %u2013 %u2013 %u2013 %u2013 %u2013Households and non-profit institutions %u2013 %u2013 %u2013 %u2013 %u2013 %u2013 %u2013 %u2013 %u2013Fines, penalties and forfeits 4 505 7 321 36 456 17 395 17 395 31 131 18 174 18 992 19 847 (41,6)Interest, dividends and rent on land %u2013 %u2013 %u2013 %u2013 %u2013 %u2013 %u2013 %u2013 %u2013Interest %u2013 %u2013 %u2013 %u2013 %u2013 %u2013 %u2013 %u2013 %u2013Dividends %u2013 %u2013 %u2013 %u2013 %u2013 %u2013 %u2013 %u2013 %u2013Rent on land %u2013 %u2013 %u2013 %u2013 %u2013 %u2013 %u2013 %u2013 %u2013Sales of capital assets 13 473 %u2013 1 136 %u2013 %u2013 10 484 %u2013 %u2013 %u2013 (100,0)Land and sub-soil assets %u2013 %u2013 %u2013 %u2013 %u2013 %u2013 %u2013 %u2013 %u2013Other capital assets 13 473 %u2013 1 136 %u2013 %u2013 10 484 %u2013 %u2013 %u2013 (100,0)Transactions in financial assets and liabilities 2 071 1 305 2 718 5 909 5 909 2 748 6 174 6 452 6 742 124,7Total departmental receipts 659 320 689 843 770 790 813 858 813 858 866 725 831 446 868 861 907 960 (4,1)2024/25683
