
Page 863 - Demo
P. 863
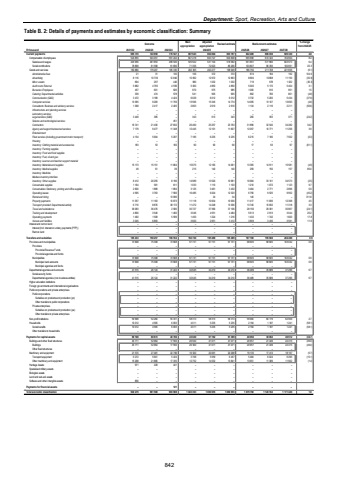
Department: Sport, Recreation, Arts and CultureTable B. 2: Details of payments and estimates by economic classification: Summary Outcome Main appropriationAdjusted appropriation Revised estimate Medium-term estimates % change from 2024/25R thousand 2021/22 2022/23 2023/24 2025/26 2026/27 2027/28Current payments 722 658 685 735 776 547 807 643 804 004 803 797 842 488 886 030 926 320 4.8Compensation of employees 524 855 543 451 591 242 607 278 603 727 604 848 655 698 674 322 704 664 8.4Salaries and wages 445 956 461 853 499 546 535 922 531 104 518 582 551 891 577 966 603 973 6.4Social contributions 78 899 81 598 91 696 71 356 72 623 86 266 103 807 96 356 100 691 20.3Goods and services 160 880 179 207 185 305 200 365 200 277 198 949 186 790 211 708 221 656 (6.1)Administrative fees 31 21 130 106 372 372 874 184 192 134.9Advertising 10 739 8 116 12 846 10 692 12 972 12 863 8 884 10 668 11 150 (30.9)Minor assets 297 694 440 980 1 032 1 032 719 978 1 022 (30.3)Audit costs: External 4 765 5 882 4 559 5 000 4 850 4 850 5 000 5 170 5 404 3.1Bursaries: Employees 457 601 926 970 975 985 1 000 910 951 1.5Catering: Departmental activities 339 474 578 541 905 905 862 766 801 (4.8)Communication (G&S) 3 472 3 189 4 424 6 029 6 012 6 012 3 732 5 200 5 434 (37.9)Computer services 13 365 9 283 11 759 13 566 15 345 14 774 14 095 13 107 13 693 (4.6)Consultants: Business and advisory services 1 368 2 417 2 405 2 803 2 610 2 610 1 134 2 116 2 211 (56.6)Infrastructure and planning services %u2013 %u2013 %u2013 %u2013 %u2013 %u2013 %u2013 %u2013 %u2013Laboratory services %u2013 %u2013 %u2013 %u2013 %u2013 %u2013 %u2013 %u2013 %u2013Legal services (G&S) 3 449 385 %u2013 343 613 343 260 355 371 (24.2)Science and technological services %u2013 %u2013 451 %u2013 %u2013 %u2013 %u2013 %u2013 %u2013Contractors 16 741 21 430 27 832 26 460 25 257 23 763 31 896 32 540 34 282 34.2Agency and support/outsourced services 7 179 9 477 11 348 12 445 12 101 11 607 12 057 10 771 11 256 3.9Entertainment %u2013 %u2013 %u2013 %u2013 %u2013 %u2013 %u2013 %u2013 %u2013Fleet services (including government motor transport) 4 134 5 904 5 297 7 185 6 235 6 235 6 215 7 180 7 502 (0.3)Housing %u2013 %u2013 %u2013 %u2013 %u2013 %u2013 %u2013 %u2013 %u2013Inventory: Clothing material and accessories 183 53 160 90 90 90 17 93 97 (81.1)Inventory: Farming supplies %u2013 %u2013 %u2013 %u2013 %u2013 %u2013 %u2013 %u2013 %u2013Inventory: Food and food supplies %u2013 %u2013 %u2013 %u2013 %u2013 %u2013 %u2013 %u2013 %u2013Inventory: Fuel, oil and gas %u2013 %u2013 %u2013 %u2013 %u2013 %u2013 %u2013 %u2013 %u2013Inventory: Learner and teacher support material %u2013 %u2013 %u2013 %u2013 %u2013 %u2013 %u2013 %u2013 %u2013Inventory: Materials and supplies 15 173 15 151 11 864 15 675 12 165 14 061 13 365 14 911 15 581 (4.9)Inventory: Medical supplies 49 61 39 215 140 140 259 150 157 85.0Inventory: Medicine %u2013 %u2013 %u2013 %u2013 %u2013 %u2013 %u2013 %u2013 %u2013Medsas inventory interface %u2013 %u2013 %u2013 %u2013 %u2013 %u2013 %u2013 %u2013 %u2013Inventory: Other supplies 8 412 20 255 8 196 14 989 13 520 10 961 10 684 33 101 34 573 (2.5)Consumable supplies 1 164 581 811 1 033 1 110 1 103 1 210 1 072 1 123 9.7Consumables: Stationery, printing and office supplies 2 600 1 889 1 894 3 125 3 461 3 432 3 464 2 771 2 896 0.9Operating leases 4 595 3 763 7 566 16 485 9 204 12 323 6 756 9 525 9 952 (45.2)Rental and hiring %u2013 %u2013 13 096 %u2013 34 34 140 %u2013 %u2013 311.8Property payments 11 357 11 163 10 873 11 118 10 934 10 930 11 417 11 836 12 368 4.5Transport provided: Departmental activity 6 710 8 876 38 172 11 472 14 248 13 306 13 740 10 832 11 318 3.3Travel and subsistence 36 083 36 476 2 580 30 727 37 366 37 106 28 156 29 381 30 867 (24.1)Training and development 4 800 3 546 1 460 3 046 4 551 4 484 5 613 2 913 3 044 25.2Operating payments 1 492 1 508 5 599 1 450 1 224 1 216 1 432 1 742 1 820 17.8Venues and facilities 3 045 6 893 %u2013 3 820 2 951 3 412 3 809 3 436 3 591 11.6Interest and rent on land %u2013 %u2013 %u2013 %u2013 %u2013 %u2013 %u2013 %u2013 %u2013Interest (Incl. interest on unitary payments (PPP)) %u2013 %u2013 %u2013 %u2013 %u2013 %u2013 %u2013 %u2013 %u2013Rent on land %u2013 %u2013 %u2013 %u2013 %u2013 %u2013 %u2013 %u2013 %u2013Transfers and subsidies 185 433 158 257 166 554 192 700 195 489 195 489 197 188 195 660 204 488 0.9 Provinces and municipalities 73 908 75 308 73 908 97 731 97 731 97 731 98 605 98 605 103 042 0.9Provinces %u2013 %u2013 %u2013 %u2013 %u2013 %u2013 %u2013 %u2013 %u2013Provincial Revenue Funds %u2013 %u2013 %u2013 %u2013 %u2013 %u2013 %u2013 %u2013 %u2013Provincial agencies and funds %u2013 %u2013 %u2013 %u2013 %u2013 %u2013 %u2013 %u2013 %u2013Municipalities 73 908 75 308 73 908 97 731 97 731 97 731 98 605 98 605 103 042 0.9Municipal bank accounts 73 908 75 308 73 908 97 731 97 731 97 731 98 605 98 605 103 042 0.9Municipal agencies and funds %u2013 %u2013 %u2013 %u2013 %u2013 %u2013 %u2013 %u2013 %u2013Departmental agencies and accounts 41 515 26 124 31 222 32 645 34 210 34 210 36 489 35 689 37 296 6.7Social security funds %u2013 %u2013 %u2013 %u2013 %u2013 %u2013 %u2013 %u2013 %u2013Departmental agencies (non-business entities) 41 515 26 124 31 222 32 645 34 210 34 210 36 489 35 689 37 296 6.7Higher education institutions %u2013 %u2013 %u2013 %u2013 %u2013 %u2013 %u2013 %u2013 %u2013Foreign governments and international organisations %u2013 %u2013 %u2013 %u2013 %u2013 %u2013 %u2013 %u2013 %u2013Public corporations and private enterprises %u2013 %u2013 %u2013 %u2013 %u2013 %u2013 %u2013 %u2013 %u2013Public corporations %u2013 %u2013 %u2013 %u2013 %u2013 %u2013 %u2013 %u2013 %u2013Subsidies on products and production (pc) %u2013 %u2013 %u2013 %u2013 %u2013 %u2013 %u2013 %u2013 %u2013Other transfers to public corporations %u2013 %u2013 %u2013 %u2013 %u2013 %u2013 %u2013 %u2013 %u2013Private enterprises %u2013 %u2013 %u2013 %u2013 %u2013 %u2013 %u2013 %u2013 %u2013Subsidies on products and production (pe) %u2013 %u2013 %u2013 %u2013 %u2013 %u2013 %u2013 %u2013 %u2013Other transfers to private enterprises %u2013 %u2013 %u2013 %u2013 %u2013 %u2013 %u2013 %u2013 %u2013Non-profit institutions 59 998 52 260 55 331 58 313 58 313 58 313 59 900 60 179 62 909 2.7Households 10 012 4 565 6 093 4 011 5 235 5 235 2 194 1 187 1 241 (58.1)Social benefits 10 012 4 565 6 093 4 011 5 235 5 235 2 194 1 187 1 241 (58.1)Other transfers to households %u2013 %u2013 %u2013 %u2013 %u2013 %u2013 %u2013 %u2013 %u2013Payments for capital assets 69 108 80 673 40 766 43 020 61 162 61 369 40 092 38 862 40 612 (34.7)Buildings and other fixed structures 45 711 52 964 17 556 26 500 41 071 41 071 20 957 21 449 22 415 (49.0)Buildings 45 711 52 964 17 556 26 500 41 071 41 071 20 957 21 449 22 415 (49.0)Other fixed structures %u2013 %u2013 %u2013 %u2013 %u2013 %u2013 %u2013 %u2013 %u2013Machinery and equipment 21 570 27 481 22 769 16 520 20 091 20 298 19 135 17 413 18 197 (5.7)Transport equipment 6 272 5 601 5 434 3 768 5 559 6 457 5 484 6 024 6 295 (15.1)Other machinery and equipment 15 298 21 880 17 335 12 752 14 532 13 841 13 651 11 389 11 902 (1.4)Heritage Assets 971 228 441 %u2013 %u2013 %u2013 %u2013 %u2013 %u2013Specialised military assets %u2013 %u2013 %u2013 %u2013 %u2013 %u2013 %u2013 %u2013 %u2013Biological assets %u2013 %u2013 %u2013 %u2013 %u2013 %u2013 %u2013 %u2013 %u2013Land and sub-soil assets %u2013 %u2013 %u2013 %u2013 %u2013 %u2013 %u2013 %u2013 %u2013Software and other intangible assets 856 %u2013 %u2013 %u2013 %u2013 %u2013 %u2013 %u2013 %u2013Payments for financial assets %u2013 %u2013 121 %u2013 %u2013 %u2013 %u2013 %u2013 %u2013Total economic classification 940 276 961 588 983 988 1 043 363 1 060 655 1 060 655 1 079 768 1 120 552 1 171 420 1.82024/25 842
