
Page 866 - Demo
P. 866
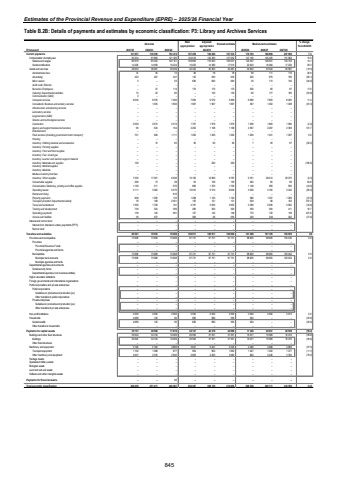
Estimates of the Provincial Revenue and Expenditure (EPRE) %u2013 2025/26 Financial YearTable B.2B: Details of payments and estimates by economic classification: P3: Library and Archives Services Outcome Main appropriationAdjusted appropriation Revised estimate Medium-term estimates % change from 2024/25R thousand 2021/22 2022/23 2023/24 2025/26 2026/27 2027/28Current payments 121 857 136 350 152 274 167 259 164 846 167 533 179 793 198 969 207 966 7.3Compensation of employees 95 204 97 883 121 325 124 916 124 383 127 052 147 190 145 425 151 969 15.9Salaries and wages 80 976 83 324 102 101 109 893 110 003 109 537 124 547 128 941 134 743 13.7Social contributions 14 228 14 559 19 224 15 023 14 380 17 515 22 643 16 484 17 226 29.3Goods and services 26 653 38 467 30 949 42 343 40 463 40 481 32 603 53 544 55 997 (19.5)Administrative fees 14 30 72 96 78 78 99 111 116 26.9Advertising 422 467 437 145 630 630 220 675 706 (65.1)Minor assets 3 %u2013 53 690 690 690 35 713 745 (94.9)Audit costs: External %u2013 %u2013 %u2013 %u2013 %u2013 %u2013 %u2013 %u2013 %u2013Bursaries: Employees %u2013 37 114 170 170 170 200 83 87 17.6Catering: Departmental activities 73 43 82 %u2013 130 130 60 177 185 (53.8)Communication (G&S) 2 %u2013 %u2013 %u2013 %u2013 %u2013 %u2013 %u2013 %u2013Computer services 8 040 8 376 7 406 7 000 6 570 5 999 6 680 7 853 8 205 11.4Consultants: Business and advisory services %u2013 1 035 1 656 1 967 1 967 1 967 367 1 252 1 308 (81.3)Infrastructure and planning services %u2013 %u2013 %u2013 %u2013 %u2013 %u2013 %u2013 %u2013 %u2013Laboratory services %u2013 %u2013 %u2013 %u2013 %u2013 %u2013 %u2013 %u2013 %u2013Legal services (G&S) %u2013 %u2013 %u2013 %u2013 %u2013 %u2013 %u2013 %u2013 %u2013Science and technological services %u2013 %u2013 %u2013 %u2013 %u2013 %u2013 %u2013 %u2013 %u2013Contractors 2 029 2 073 2 374 1 767 1 979 1 979 1 936 1 863 1 990 (2.2)Agency and support/outsourced services 95 543 154 2 202 1 108 1 108 2 567 2 267 2 369 131.7Entertainment %u2013 %u2013 %u2013 %u2013 %u2013 %u2013 %u2013 %u2013 %u2013Fleet services (including government motor transport) 701 928 1 111 1 200 1 200 1 200 1 200 1 241 1 297 0.0Housing %u2013 %u2013 %u2013 %u2013 %u2013 %u2013 %u2013 %u2013 %u2013Inventory: Clothing material and accessories %u2013 10 65 90 90 90 7 93 97 (92.2)Inventory: Farming supplies %u2013 %u2013 %u2013 %u2013 %u2013 %u2013 %u2013 %u2013 %u2013Inventory: Food and food supplies %u2013 %u2013 %u2013 %u2013 %u2013 %u2013 %u2013 %u2013 %u2013Inventory: Fuel, oil and gas %u2013 %u2013 %u2013 %u2013 %u2013 %u2013 %u2013 %u2013 %u2013Inventory: Learner and teacher support material %u2013 %u2013 %u2013 %u2013 %u2013 %u2013 %u2013 %u2013 %u2013Inventory: Materials and supplies 100 %u2013 %u2013 %u2013 200 200 %u2013 %u2013 %u2013 (100.0)Inventory: Medical supplies %u2013 %u2013 %u2013 %u2013 %u2013 %u2013 %u2013 %u2013 %u2013Inventory: Medicine %u2013 %u2013 %u2013 %u2013 %u2013 %u2013 %u2013 %u2013 %u2013Medsas inventory interface %u2013 %u2013 %u2013 %u2013 %u2013 %u2013 %u2013 %u2013 %u2013Inventory: Other supplies 7 320 17 291 6 936 10 100 12 850 9 787 9 761 28 014 29 275 (0.3)Consumable supplies 266 73 28 63 159 159 262 65 68 64.8Consumables: Stationery, printing and office supplies 1 100 311 570 880 1 763 1 763 1 148 909 950 (34.9)Operating leases 3 111 3 362 5 270 10 910 5 510 8 629 3 000 3 102 3 242 (65.2)Rental and hiring %u2013 %u2013 816 %u2013 %u2013 %u2013 %u2013 %u2013 %u2013Property payments 838 1 250 133 1 298 1 125 1 125 586 1 227 1 282 (47.9)Transport provided: Departmental activity 76 108 2 501 125 121 121 529 98 102 337.2Travel and subsistence 1 550 1 729 191 2 767 3 635 3 653 2 389 2 930 3 062 (34.6)Training and development 739 324 399 380 300 300 350 393 411 16.7Operating payments 139 140 581 127 142 148 772 132 138 421.6Venues and facilities 35 337 %u2013 366 46 555 435 346 362 (21.6)Interest and rent on land %u2013 %u2013 %u2013 %u2013 %u2013 %u2013 %u2013 %u2013 %u2013Interest (Incl. interest on unitary payments (PPP)) %u2013 %u2013 %u2013 %u2013 %u2013 %u2013 %u2013 %u2013 %u2013Rent on land %u2013 %u2013 %u2013 %u2013 %u2013 %u2013 %u2013 %u2013 %u2013Transfers and subsidies 80 597 76 553 76 498 100 911 100 911 100 626 101 399 101 105 105 655 0.8 Provinces and municipalities 73 908 73 908 73 908 97 731 97 731 97 731 98 605 98 605 103 042 0.9Provinces %u2013 %u2013 %u2013 %u2013 %u2013 %u2013 %u2013 %u2013 %u2013Provincial Revenue Funds %u2013 %u2013 %u2013 %u2013 %u2013 %u2013 %u2013 %u2013 %u2013Provincial agencies and funds %u2013 %u2013 %u2013 %u2013 %u2013 %u2013 %u2013 %u2013 %u2013Municipalities 73 908 73 908 73 908 97 731 97 731 97 731 98 605 98 605 103 042 0.9Municipal bank accounts 73 908 73 908 73 908 97 731 97 731 97 731 98 605 98 605 103 042 0.9Municipal agencies and funds %u2013 %u2013 %u2013 %u2013 %u2013 %u2013 %u2013 %u2013 %u2013Departmental agencies and accounts %u2013 %u2013 %u2013 %u2013 %u2013 %u2013 %u2013 %u2013 %u2013Social security funds %u2013 %u2013 %u2013 %u2013 %u2013 %u2013 %u2013 %u2013 %u2013Departmental agencies (non-business entities) %u2013 %u2013 %u2013 %u2013 %u2013 %u2013 %u2013 %u2013 %u2013Higher education institutions %u2013 %u2013 %u2013 %u2013 %u2013 %u2013 %u2013 %u2013 %u2013Foreign governments and international organisations %u2013 %u2013 %u2013 %u2013 %u2013 %u2013 %u2013 %u2013 %u2013Public corporations and private enterprises %u2013 %u2013 %u2013 %u2013 %u2013 %u2013 %u2013 %u2013 %u2013Public corporations %u2013 %u2013 %u2013 %u2013 %u2013 %u2013 %u2013 %u2013 %u2013Subsidies on products and production (pc) %u2013 %u2013 %u2013 %u2013 %u2013 %u2013 %u2013 %u2013 %u2013Other transfers to public corporations %u2013 %u2013 %u2013 %u2013 %u2013 %u2013 %u2013 %u2013 %u2013Private enterprises %u2013 %u2013 %u2013 %u2013 %u2013 %u2013 %u2013 %u2013 %u2013Subsidies on products and production (pe) %u2013 %u2013 %u2013 %u2013 %u2013 %u2013 %u2013 %u2013 %u2013Other transfers to private enterprises %u2013 %u2013 %u2013 %u2013 %u2013 %u2013 %u2013 %u2013 %u2013Non-profit institutions 2 000 2 500 2 500 2 500 2 500 2 500 2 500 2 500 2 613 0.0Households 4 689 145 90 680 680 395 294 %u2013 %u2013 (25.6)Social benefits 4 689 145 90 680 680 395 294 %u2013 %u2013 (25.6)Other transfers to households %u2013 %u2013 %u2013 %u2013 %u2013 %u2013 %u2013 %u2013 %u2013Payments for capital assets 35 751 38 508 17 878 24 127 42 378 42 696 17 346 20 037 20 939 (59.4)Buildings and other fixed structures 30 642 34 744 14 009 20 500 37 351 37 351 15 077 15 569 16 270 (59.6)Buildings 30 642 34 744 14 009 20 500 37 351 37 351 15 077 15 569 16 270 (59.6)Other fixed structures %u2013 %u2013 %u2013 %u2013 %u2013 %u2013 %u2013 %u2013 %u2013Machinery and equipment 5 109 3 764 3 869 3 627 5 027 5 345 2 269 4 468 4 669 (57.5)Transport equipment 1 102 1 388 877 964 964 1 662 1 467 1 222 1 277 (11.7)Other machinery and equipment 4 007 2 376 2 992 2 663 4 063 3 683 802 3 246 3 392 (78.2)Heritage Assets %u2013 %u2013 %u2013 %u2013 %u2013 %u2013 %u2013 %u2013 %u2013Specialised military assets %u2013 %u2013 %u2013 %u2013 %u2013 %u2013 %u2013 %u2013 %u2013Biological assets %u2013 %u2013 %u2013 %u2013 %u2013 %u2013 %u2013 %u2013 %u2013Land and sub-soil assets %u2013 %u2013 %u2013 %u2013 %u2013 %u2013 %u2013 %u2013 %u2013Software and other intangible assets %u2013 %u2013 %u2013 %u2013 %u2013 %u2013 %u2013 %u2013 %u2013Payments for financial assets %u2013 %u2013 31 %u2013 %u2013 %u2013 %u2013 %u2013 %u2013Total economic classification 238 205 251 411 246 681 292 297 308 135 310 855 298 538 320 111 334 560 (4.0)2024/25845
