
Page 865 - Demo
P. 865
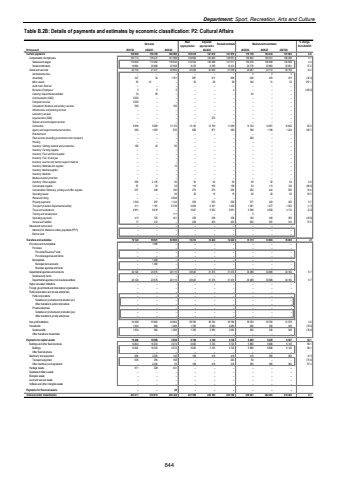
Department: Sport, Recreation, Arts and CultureTable B.2B: Details of payments and estimates by economic classification: P2: Cultural Affairs Outcome Main appropriationAdjusted appropriation Revised estimate Medium-term estimates % change from 2024/25R thousand 2021/22 2022/23 2023/24 2025/26 2026/27 2027/28Current payments 156 708 150 846 168 090 165 218 167 810 167 810 179 139 183 433 191 683 6.8Compensation of employees 130 714 135 231 141 098 142 992 145 284 146 551 154 852 159 321 166 489 5.7Salaries and wages 110 820 114 262 118 540 134 520 136 498 127 077 130 076 136 458 142 598 2.4Social contributions 19 894 20 969 22 558 8 472 8 786 19 474 24 776 22 863 23 891 27.2Goods and services 20 132 21 477 26 992 22 226 22 526 21 259 24 287 24 112 25 194 14.2Administrative fees %u2013 %u2013 %u2013 %u2013 %u2013 %u2013 3 2 2 Advertising 32 347 1 761 887 917 808 546 453 473 (32.4)Minor assets -10 %u2013 53 35 28 28 100 31 32 257.1Audit costs: External %u2013 %u2013 %u2013 %u2013 %u2013 %u2013 %u2013 %u2013 %u2013Bursaries: Employees 5 2 3 %u2013 %u2013 4 %u2013 %u2013 %u2013 (100.0)Catering: Departmental activities 33 59 %u2013 %u2013 %u2013 %u2013 84 %u2013 %u2013Communication (G&S) 3 000 %u2013 %u2013 %u2013 %u2013 %u2013 %u2013 %u2013 %u2013Computer services 3 500 %u2013 %u2013 %u2013 %u2013 %u2013 %u2013 %u2013 %u2013Consultants: Business and advisory services 299 %u2013 100 %u2013 %u2013 %u2013 %u2013 %u2013 %u2013Infrastructure and planning services %u2013 %u2013 %u2013 %u2013 %u2013 %u2013 %u2013 %u2013 %u2013Laboratory services %u2013 %u2013 %u2013 %u2013 %u2013 %u2013 %u2013 %u2013 %u2013Legal services (G&S) %u2013 %u2013 %u2013 %u2013 270 %u2013 %u2013 %u2013 %u2013Science and technological services %u2013 %u2013 %u2013 %u2013 %u2013 %u2013 %u2013 %u2013 %u2013Contractors 4 966 9 269 13 133 13 145 12 759 11 265 14 122 14 951 15 622 25.4Agency and support/outsourced services 282 1 053 525 606 877 383 788 1 190 1 244 105.7Entertainment %u2013 %u2013 %u2013 %u2013 %u2013 %u2013 %u2013 %u2013 %u2013Fleet services (including government motor transport) %u2013 %u2013 %u2013 %u2013 %u2013 %u2013 200 %u2013 %u2013Housing %u2013 %u2013 %u2013 %u2013 %u2013 %u2013 %u2013 %u2013 %u2013Inventory: Clothing material and accessories 128 43 95 %u2013 %u2013 %u2013 %u2013 %u2013 %u2013Inventory: Farming supplies %u2013 %u2013 %u2013 %u2013 %u2013 %u2013 %u2013 %u2013 %u2013Inventory: Food and food supplies %u2013 %u2013 %u2013 %u2013 %u2013 %u2013 %u2013 %u2013 %u2013Inventory: Fuel, oil and gas %u2013 %u2013 %u2013 %u2013 %u2013 %u2013 %u2013 %u2013 %u2013Inventory: Learner and teacher support material %u2013 %u2013 %u2013 %u2013 %u2013 %u2013 %u2013 %u2013 %u2013Inventory: Materials and supplies %u2013 %u2013 10 %u2013 %u2013 %u2013 %u2013 %u2013 %u2013Inventory: Medical supplies %u2013 %u2013 %u2013 %u2013 %u2013 %u2013 %u2013 %u2013 %u2013Inventory: Medicine %u2013 %u2013 %u2013 %u2013 %u2013 %u2013 %u2013 %u2013 %u2013Medsas inventory interface %u2013 %u2013 %u2013 %u2013 %u2013 %u2013 %u2013 %u2013 %u2013Inventory: Other supplies 393 2 135 50 50 50 50 50 52 54 0.0Consumable supplies 97 33 34 110 165 158 53 113 120 (66.5)Consumables: Stationery, printing and office supplies 237 248 180 275 275 225 262 244 255 16.4Operating leases %u2013 %u2013 39 20 15 15 20 20 20 33.3Rental and hiring %u2013 %u2013 2 648 %u2013 %u2013 %u2013 %u2013 %u2013 %u2013Property payments 1 040 297 1 144 530 530 526 577 433 452 9.7Transport provided: Departmental activity 411 1 161 6 738 2 064 2 347 1 405 1 381 1 477 1 543 (1.7)Travel and subsistence 4 851 6 018 %u2013 3 947 3 502 5 651 5 358 4 509 4 712 (5.2)Training and development %u2013 %u2013 111 %u2013 %u2013 %u2013 5 %u2013 %u2013Operating payments 413 725 421 329 338 338 184 340 355 (45.6)Venues and facilities 77 412 %u2013 228 453 403 554 297 310 37.5Interest and rent on land %u2013 %u2013 %u2013 %u2013 %u2013 %u2013 %u2013 %u2013 %u2013Interest (Incl. interest on unitary payments (PPP)) %u2013 %u2013 %u2013 %u2013 %u2013 %u2013 %u2013 %u2013 %u2013Rent on land %u2013 %u2013 %u2013 %u2013 %u2013 %u2013 %u2013 %u2013 %u2013Transfers and subsidies 76 122 59 621 64 568 70 212 72 242 72 242 73 773 72 803 76 083 2.1 Provinces and municipalities %u2013 1 400 %u2013 %u2013 %u2013 %u2013 %u2013 %u2013 %u2013Provinces %u2013 %u2013 %u2013 %u2013 %u2013 %u2013 %u2013 %u2013 %u2013Provincial Revenue Funds %u2013 %u2013 %u2013 %u2013 %u2013 %u2013 %u2013 %u2013 %u2013Provincial agencies and funds %u2013 %u2013 %u2013 %u2013 %u2013 %u2013 %u2013 %u2013 %u2013Municipalities %u2013 1 400 %u2013 %u2013 %u2013 %u2013 %u2013 %u2013 %u2013Municipal bank accounts %u2013 1 400 %u2013 %u2013 %u2013 %u2013 %u2013 %u2013 %u2013Municipal agencies and funds %u2013 %u2013 %u2013 %u2013 %u2013 %u2013 %u2013 %u2013 %u2013Departmental agencies and accounts 40 120 23 575 28 115 29 645 31 375 31 375 33 489 32 689 34 160 6.7Social security funds %u2013 %u2013 %u2013 %u2013 %u2013 %u2013 %u2013 %u2013 %u2013Departmental agencies (non-business entities) 40 120 23 575 28 115 29 645 31 375 31 375 33 489 32 689 34 160 6.7Higher education institutions %u2013 %u2013 %u2013 %u2013 %u2013 %u2013 %u2013 %u2013 %u2013Foreign governments and international organisations %u2013 %u2013 %u2013 %u2013 %u2013 %u2013 %u2013 %u2013 %u2013Public corporations and private enterprises %u2013 %u2013 %u2013 %u2013 %u2013 %u2013 %u2013 %u2013 %u2013Public corporations %u2013 %u2013 %u2013 %u2013 %u2013 %u2013 %u2013 %u2013 %u2013Subsidies on products and production (pc) %u2013 %u2013 %u2013 %u2013 %u2013 %u2013 %u2013 %u2013 %u2013Other transfers to public corporations %u2013 %u2013 %u2013 %u2013 %u2013 %u2013 %u2013 %u2013 %u2013Private enterprises %u2013 %u2013 %u2013 %u2013 %u2013 %u2013 %u2013 %u2013 %u2013Subsidies on products and production (pe) %u2013 %u2013 %u2013 %u2013 %u2013 %u2013 %u2013 %u2013 %u2013Other transfers to private enterprises %u2013 %u2013 %u2013 %u2013 %u2013 %u2013 %u2013 %u2013 %u2013Non-profit institutions 34 498 33 662 34 964 38 784 38 784 38 784 39 784 39 784 41 578 2.6Households 1 504 984 1 489 1 783 2 083 2 083 500 330 345 (76.0)Social benefits 1 504 984 1 489 1 783 2 083 2 083 500 330 345 (76.0)Other transfers to households %u2013 %u2013 %u2013 %u2013 %u2013 %u2013 %u2013 %u2013 %u2013Payments for capital assets 16 449 18 586 3 658 6 168 4 138 4 138 6 295 6 245 6 527 52.1Buildings and other fixed structures 14 842 16 033 3 074 6 000 3 720 3 720 5 880 5 880 6 145 58.1Buildings 14 842 16 033 3 074 6 000 3 720 3 720 5 880 5 880 6 145 58.1Other fixed structures %u2013 %u2013 %u2013 %u2013 %u2013 %u2013 %u2013 %u2013 %u2013Machinery and equipment 636 2 325 143 168 418 418 415 365 382 (0.7)Transport equipment 636 295 108 %u2013 %u2013 200 50 %u2013 %u2013 (75.0)Other machinery and equipment %u2013 2 030 35 168 418 218 365 365 382 67.4Heritage Assets 971 228 441 %u2013 %u2013 %u2013 %u2013 %u2013 %u2013Specialised military assets %u2013 %u2013 %u2013 %u2013 %u2013 %u2013 %u2013 %u2013 %u2013Biological assets %u2013 %u2013 %u2013 %u2013 %u2013 %u2013 %u2013 %u2013 %u2013Land and sub-soil assets %u2013 %u2013 %u2013 %u2013 %u2013 %u2013 %u2013 %u2013 %u2013Software and other intangible assets %u2013 %u2013 %u2013 %u2013 %u2013 %u2013 %u2013 %u2013 %u2013Payments for financial assets %u2013 %u2013 28 %u2013 %u2013 %u2013 %u2013 %u2013 %u2013Total economic classification 243 417 234 915 236 344 241 598 244 190 244 190 259 207 262 481 274 293 6.12024/25844
