
Page 864 - Demo
P. 864
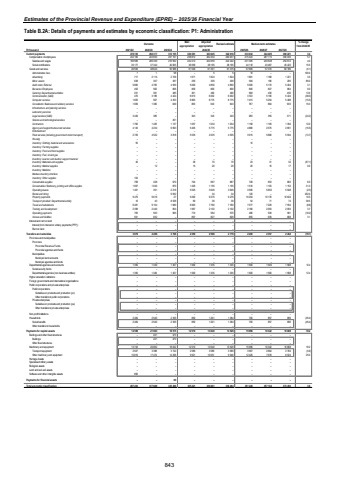
Estimates of the Provincial Revenue and Expenditure (EPRE) %u2013 2025/26 Financial YearTable B.2A: Details of payments and estimates by economic classification: P1: AdministrationOutcome Main appropriationAdjusted appropriation Revised estimate Medium-term estimates % change from 2024/25R thousand 2021/22 2022/23 2023/24 2025/26 2026/27 2027/28Current payments 278 725 292 317 313 155 320 361 323 645 322 016 333 032 344 485 360 221 3.4Compensation of employees 232 166 243 693 257 167 258 812 262 254 260 637 275 423 287 115 300 035 5.7Salaries and wages 196 989 206 349 216 562 222 213 224 059 222 442 231 305 243 648 254 612 4.0Social contributions 35 177 37 344 40 605 36 599 38 195 38 195 44 118 43 467 45 423 15.5Goods and services 46 559 48 624 55 988 61 549 61 391 61 379 57 609 57 370 60 186 (6.1)Administrative fees 7 1 58 %u2013 5 5 10 %u2013 %u2013 100.0Advertising 717 2 115 2 726 1 671 1 624 1 624 1 681 1 168 1 221 3.5Minor assets 638 307 387 255 309 309 584 196 205 89.0Audit costs: External 5 882 4 765 4 559 5 000 4 850 4 850 5 000 5 170 5 404 3.1Bursaries: Employees 452 562 806 800 800 800 800 827 864 0.0Catering: Departmental activities 231 361 485 391 490 490 558 430 450 13.9Communication (G&S) 470 3 189 4 424 6 019 6 002 6 002 3 722 5 190 5 424 (38.0)Computer services 1 825 907 4 353 6 566 8 775 8 775 7 415 5 254 5 488 (15.5)Consultants: Business and advisory services 1 069 1 382 649 836 643 643 767 864 903 19.3Infrastructure and planning services %u2013 %u2013 %u2013 %u2013 %u2013 %u2013 %u2013 %u2013 %u2013Laboratory services %u2013 %u2013 %u2013 %u2013 %u2013 %u2013 %u2013 %u2013 %u2013Legal services (G&S) 3 449 385 %u2013 343 343 343 260 355 371 (24.2)Science and technological services %u2013 %u2013 451 %u2013 %u2013 %u2013 %u2013 %u2013 %u2013Contractors 1 760 1 425 1 137 1 057 1 034 1 034 1 158 1 109 1 394 12.0Agency and support/outsourced services 4 145 4 234 6 693 5 405 5 775 5 775 4 880 2 575 2 691 (15.5)Entertainment %u2013 %u2013 %u2013 %u2013 %u2013 %u2013 %u2013 %u2013 %u2013Fleet services (including government motor transport) 2 729 4 522 3 818 5 535 4 535 4 535 3 915 5 680 5 934 (13.7)Housing %u2013 %u2013 %u2013 %u2013 %u2013 %u2013 %u2013 %u2013 %u2013Inventory: Clothing material and accessories 55 %u2013 %u2013 %u2013 %u2013 %u2013 10 %u2013 %u2013Inventory: Farming supplies %u2013 %u2013 %u2013 %u2013 %u2013 %u2013 %u2013 %u2013 %u2013Inventory: Food and food supplies %u2013 %u2013 %u2013 %u2013 %u2013 %u2013 %u2013 %u2013 %u2013Inventory: Fuel, oil and gas %u2013 %u2013 %u2013 %u2013 %u2013 %u2013 %u2013 %u2013 %u2013Inventory: Learner and teacher support material %u2013 %u2013 %u2013 %u2013 %u2013 %u2013 %u2013 %u2013 %u2013Inventory: Materials and supplies 40 %u2013 %u2013 38 70 70 23 31 32 (67.1)Inventory: Medical supplies %u2013 12 %u2013 15 20 20 20 16 17 0.0Inventory: Medicine %u2013 %u2013 %u2013 %u2013 %u2013 %u2013 %u2013 %u2013 %u2013Medsas inventory interface %u2013 %u2013 %u2013 %u2013 %u2013 %u2013 %u2013 %u2013 %u2013Inventory: Other supplies 104 %u2013 %u2013 %u2013 %u2013 %u2013 %u2013 %u2013 %u2013Consumable supplies 768 428 670 704 687 687 728 653 683 6.0Consumables: Stationery, printing and office supplies 1 067 1 040 870 1 429 1 155 1 155 1 516 1 103 1 153 31.3Operating leases 1 461 391 2 216 5 525 3 649 3 649 3 556 5 692 5 948 (2.5)Rental and hiring %u2013 %u2013 9 632 %u2013 34 34 120 %u2013 %u2013 252.9Property payments 9 479 9 616 27 9 290 9 279 9 279 10 254 10 176 10 634 10.5Transport provided: Departmental activity 16 43 8 528 69 39 39 54 71 74 38.5Travel and subsistence 6 481 9 104 1 680 6 963 7 760 7 760 7 077 7 229 7 554 (8.8)Training and development 2 398 2 440 854 1 967 2 102 2 102 2 180 2 003 2 093 3.7Operating payments 765 563 965 774 584 570 466 939 981 (18.2)Venues and facilities 551 832 %u2013 897 827 829 855 639 668 3.1Interest and rent on land %u2013 %u2013 %u2013 %u2013 %u2013 %u2013 %u2013 %u2013 %u2013Interest (Incl. interest on unitary payments (PPP)) %u2013 %u2013 %u2013 %u2013 %u2013 %u2013 %u2013 %u2013 %u2013Rent on land %u2013 %u2013 %u2013 %u2013 %u2013 %u2013 %u2013 %u2013 %u2013Transfers and subsidies 3 879 4 289 3 766 2 350 2 596 2 719 2 200 2 357 2 464 (19.1)Provinces and municipalities %u2013 %u2013 %u2013 %u2013 %u2013 %u2013 %u2013 %u2013 %u2013Provinces %u2013 %u2013 %u2013 %u2013 %u2013 %u2013 %u2013 %u2013 %u2013Provincial Revenue Funds %u2013 %u2013 %u2013 %u2013 %u2013 %u2013 %u2013 %u2013 %u2013Provincial agencies and funds %u2013 %u2013 %u2013 %u2013 %u2013 %u2013 %u2013 %u2013 %u2013Municipalities %u2013 %u2013 %u2013 %u2013 %u2013 %u2013 %u2013 %u2013 %u2013Municipal bank accounts %u2013 %u2013 %u2013 %u2013 %u2013 %u2013 %u2013 %u2013 %u2013Municipal agencies and funds %u2013 %u2013 %u2013 %u2013 %u2013 %u2013 %u2013 %u2013 %u2013Departmental agencies and accounts 1 395 1 349 1 407 1 500 1 335 1 335 1 500 1 500 1 568 12.4Social security funds %u2013 %u2013 %u2013 %u2013 %u2013 %u2013 %u2013 %u2013 %u2013Departmental agencies (non-business entities) 1 395 1 349 1 407 1 500 1 335 1 335 1 500 1 500 1 568 12.4Higher education institutions %u2013 %u2013 %u2013 %u2013 %u2013 %u2013 %u2013 %u2013 %u2013Foreign governments and international organisations %u2013 %u2013 %u2013 %u2013 %u2013 %u2013 %u2013 %u2013 %u2013Public corporations and private enterprises %u2013 %u2013 %u2013 %u2013 %u2013 %u2013 %u2013 %u2013 %u2013Public corporations %u2013 %u2013 %u2013 %u2013 %u2013 %u2013 %u2013 %u2013 %u2013Subsidies on products and production (pc) %u2013 %u2013 %u2013 %u2013 %u2013 %u2013 %u2013 %u2013 %u2013Other transfers to public corporations %u2013 %u2013 %u2013 %u2013 %u2013 %u2013 %u2013 %u2013 %u2013Private enterprises %u2013 %u2013 %u2013 %u2013 %u2013 %u2013 %u2013 %u2013 %u2013Subsidies on products and production (pe) %u2013 %u2013 %u2013 %u2013 %u2013 %u2013 %u2013 %u2013 %u2013Other transfers to private enterprises %u2013 %u2013 %u2013 %u2013 %u2013 %u2013 %u2013 %u2013 %u2013Non-profit institutions %u2013 %u2013 %u2013 %u2013 %u2013 %u2013 %u2013 %u2013 %u2013Households 2 484 2 940 2 359 850 1 261 1 384 700 857 896 (49.4)Social benefits 2 484 2 940 2 359 850 1 261 1 384 700 857 896 (49.4)Other transfers to households %u2013 %u2013 %u2013 %u2013 %u2013 %u2013 %u2013 %u2013 %u2013Payments for capital assets 14 599 21 083 18 515 12 510 13 640 13 529 15 996 10 342 10 808 18.2Buildings and other fixed structures %u2013 221 473 %u2013 %u2013 %u2013 %u2013 %u2013 %u2013Buildings %u2013 221 473 %u2013 %u2013 %u2013 %u2013 %u2013 %u2013Other fixed structures %u2013 %u2013 %u2013 %u2013 %u2013 %u2013 %u2013 %u2013 %u2013Machinery and equipment 13 743 20 862 18 042 12 510 13 640 13 529 15 996 10 342 10 808 18.2Transport equipment 2 927 3 388 3 744 2 589 3 589 3 589 3 567 2 664 2 784 (0.6)Other machinery and equipment 10 816 17 474 14 298 9 921 10 051 9 940 12 429 7 678 8 024 25.0Heritage Assets %u2013 %u2013 %u2013 %u2013 %u2013 %u2013 %u2013 %u2013 %u2013Specialised military assets %u2013 %u2013 %u2013 %u2013 %u2013 %u2013 %u2013 %u2013 %u2013Biological assets %u2013 %u2013 %u2013 %u2013 %u2013 %u2013 %u2013 %u2013 %u2013Land and sub-soil assets %u2013 %u2013 %u2013 %u2013 %u2013 %u2013 %u2013 %u2013 %u2013Software and other intangible assets 856 %u2013 %u2013 %u2013 %u2013 %u2013 %u2013 %u2013 %u2013Payments for financial assets %u2013 %u2013 60 %u2013 %u2013 %u2013 %u2013 %u2013 %u2013Total economic classification 297 203 317 689 335 496 335 221 339 881 338 264 351 228 357 184 373 493 3.82024/25 843
