
Page 475 - Provincial Treasury Estimates.pdf
P. 475
Estimates of the Provincial Revenue and Expenditure (EPRE) – 2023/24 Financial Year
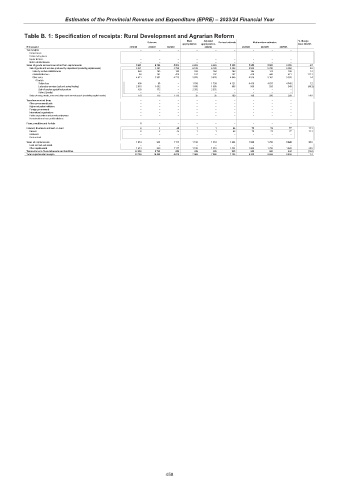
Table B. 1: Specification of receipts: Rural Development and Agrarian Reform
Main Adjusted % change
Outcome Revised estimate Medium-term estimates
appropriation appropriation from 2022/23
R thousand 2019/20 2020/21 2021/22 2022/23 2023/24 2024/25 2025/26
Tax receipts – – – – – – – – –
Casino taxes – – – – – – – – –
Horse racing taxes – – – – – – – – –
Liquor licences – – – – – – – – –
Motor vehicle licences – – – – – – – – –
Sales of goods and services other than capital assets 5 691 4 396 5 903 6 223 6 223 5 306 5 650 5 980 6 259 6.5
Sale of goods and services produced by department (excluding capital assets) 5 521 4 281 4 790 6 188 6 188 5 206 5 500 5 780 6 050 5.6
Sales by market establishments 850 163 149 163 163 163 165 178 186 1.2
Administrative fees 60 161 428 197 197 197 419 440 471 112.7
Other sales 4 611 3 957 4 213 5 828 5 828 4 846 4 916 5 162 5 393 1.4
Of which
Tuition fees 400 98 – 1 799 1 799 4 121 4 416 4 637 4 845 7.2
Laboratory services (soil and animal testing) 2 916 1 052 – 1 695 1 695 986 500 525 549 (49.3)
Sale of surplus agricultural produce 420 172 – 2 352 2 352 – – – –
Other (Specify) – – – – – – – – –
Sales of scrap, waste, arms and other used current goods (excluding capital assets) 170 115 1 113 35 35 100 150 200 209 50.0
Transfers received from: – – – – – – – – –
Other governmental units – – – – – – – – –
Higher education institutions – – – – – – – – –
Foreign governments – – – – – – – – –
International organisations – – – – – – – – –
Public corporations and private enterprises – – – – – – – – –
Households and non-profit institutions – – – – – – – – –
Fines, penalties and forfeits 1 – – – – – – – –
Interest, dividends and rent on land 8 2 45 1 1 63 70 74 77 11.1
Interest 8 2 45 1 1 63 70 74 77 11.1
Dividends – – – – – – – – –
Rent on land – – – – – – – – –
Sales of capital assets 1 614 930 1 117 1 510 1 510 1 434 1 800 1 750 1 828 25.5
Land and sub-soil assets – – – – – – – – –
Other capital assets 1 614 930 1 117 1 510 1 510 1 434 1 800 1 750 1 828 25.5
Transactions in financial assets and liabilities 32 480 8 741 954 228 228 920 800 890 930 (13.0)
Total departmental receipts 39 794 14 069 8 019 7 962 7 962 7 723 8 320 8 694 9 094 7.7
458