
Page 479 - Provincial Treasury Estimates.pdf
P. 479
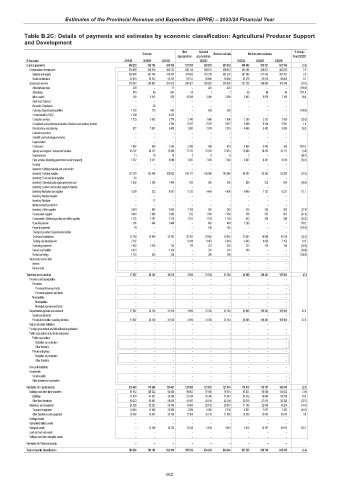
Estimates of the Provincial Revenue and Expenditure (EPRE) – 2023/24 Financial Year
Table B.2C: Details of payments and estimates by economic classification: Agricultural Producer Support
and Development
Main Adjusted % change
Outcome Revised estimate Medium-term estimates
appropriation appropriation from 2022/23
R thousand 2019/20 2020/21 2021/22 2022/23 2023/24 2024/25 2025/26
Current payments 654 232 596 799 631 595 727 035 685 833 685 832 661 402 596 521 623 184 (3.6)
Compensation of employees 378 889 359 816 364 572 436 114 399 911 399 912 430 164 436 617 455 835 7.6
Salaries and wages 326 008 307 144 310 431 374 603 341 219 341 220 367 885 371 542 387 767 7.8
Social contributions 52 881 52 672 54 141 61 511 58 692 58 692 62 279 65 075 68 068 6.1
Goods and services 275 343 236 983 267 023 290 921 285 922 285 920 231 238 159 904 167 349 (19.1)
Administrative fees 226 – 71 – 423 423 – – – (100.0)
Advertising 816 59 647 85 7 7 89 94 98 1171.4
Minor assets 150 5 813 625 15 298 3 000 3 000 5 082 6 878 7 195 69.4
Audit cost: External – – – – – – – – –
Bursaries: Employees – 39 – – – – – – –
Catering: Departmental activities 1 126 175 642 – 529 526 – – – (100.0)
Communication (G&S) 1 209 – 4 822 – – – – – –
Computer services 1 723 1 062 2 774 2 140 1 606 1 606 1 200 2 323 2 430 (25.3)
Consultants and professional services: Business and advisory services – – 2 704 5 017 5 017 5 017 5 099 5 328 5 541 1.6
Infrastructure and planning 872 7 061 3 405 2 082 2 919 2 916 4 486 3 452 3 093 53.8
Laboratory services – – – – – – – – –
Scientific and technological services – – – – – – – – –
Legal services – – – – – – – – –
Contractors 7 097 349 1 545 2 200 428 423 4 950 3 445 350 1070.2
Agency and support / outsourced services 45 707 65 137 73 499 77 725 72 915 72 915 70 000 19 232 20 117 (4.0)
Entertainment 11 10 10 2 6 6 2 – – (66.7)
Fleet services (including government motor transport) 7 257 6 517 9 888 2 587 7 035 7 583 4 697 8 431 8 819 (38.1)
Housing – – – – – – – – –
Inventory: Clothing material and accessories – – – – – – – – –
Inventory: Farming supplies 157 378 123 444 108 002 148 171 145 966 145 966 94 387 83 303 93 289 (35.3)
Inventory: Food and food supplies 63 – – – – – – – –
Inventory: Chemicals,fuel,oil,gas,wood and coal 1 052 1 388 1 404 835 595 595 200 912 954 (66.4)
Inventory: Learner and teacher support material – – – – – – – – –
Inventory: Materials and supplies 5 390 212 9 651 5 133 4 496 4 496 9 489 7 723 6 217 111.1
Inventory: Medical supplies – – – – – – – – –
Inventory: Medicine – 77 – – – – – – –
Medsas inventory interface – – – – – – – – –
Inventory: Other supplies 3 619 963 8 930 1 125 953 953 215 250 262 (77.4)
Consumable supplies 4 448 1 908 2 983 532 1 058 1 058 556 581 607 (47.4)
Consumable: Stationery,printing and office supplies 1 125 1 167 1 518 1 251 1 124 1 124 413 329 344 (63.3)
Operating leases 195 434 1 446 – 463 463 1 200 – – 159.2
Property payments 79 – – – 145 145 – – – (100.0)
Transport provided: Departmental activity – – – – – – – – –
Travel and subsistence 27 184 18 990 30 782 20 181 29 952 29 952 22 407 10 656 10 745 (25.2)
Training and development 2 197 – – 6 439 6 467 5 919 6 543 6 838 7 153 10.5
Operating payments 1 683 1 818 125 118 237 246 123 129 135 (50.0)
Venues and facilities 3 621 – 1 320 – 331 331 100 – – (69.8)
Rental and hiring 1 115 360 230 – 250 250 – – – (100.0)
Interest and rent on land – – – – – – – – –
Interest – – – – – – – – –
Rent on land – – – – – – – – –
Transfers and subsidies 17 597 28 129 31 510 3 509 31 740 31 740 46 905 159 481 159 906 47.8
Provinces and municipalities – – – – – – – – –
Provinces – – – – – – – – –
Provincial Revenue Funds – – – – – – – – –
Provincial agencies and funds – – – – – – – – –
Municipalities – – – – – – – – –
Municipalities – – – – – – – – –
Municipal agencies and funds – – – – – – – – –
Departmental agencies and accounts 17 597 28 129 31 510 3 509 31 740 31 740 46 905 159 481 159 906 47.8
Social security funds – – – – – – – – –
Provide list of entities receiving transfers 17 597 28 129 31 510 3 509 31 740 31 740 46 905 159 481 159 906 47.8
Higher education institutions – – – – – – – – –
Foreign governments and international organisations – – – – – – – – –
Public corporations and private enterprises – – – – – – – – –
Public corporations – – – – – – – – –
Subsidies on production – – – – – – – – –
Other transfers – – – – – – – – –
Private enterprises – – – – – – – – –
Subsidies on production – – – – – – – – –
Other transfers – – – – – – – – –
Non-profit institutions – – – – – – – – –
Households – – – – – – – – –
Social benefits – – – – – – – – –
Other transfers to households – – – – – – – – –
Payments for capital assets 116 440 174 268 159 461 125 085 121 672 121 674 118 818 130 707 142 845 (2.3)
Buildings and other fixed structures 91 912 126 632 94 439 99 863 97 450 97 451 93 631 98 500 114 032 (3.9)
Buildings 31 679 41 631 36 385 57 916 55 346 55 347 65 312 70 685 85 708 18.0
Other fixed structures 60 233 85 001 58 054 41 947 42 104 42 104 28 319 27 815 28 324 (32.7)
Machinery and equipment 24 528 32 527 50 744 13 684 20 612 20 613 17 169 22 060 18 200 (16.7)
Transport equipment 10 046 17 080 25 988 2 580 8 500 8 730 4 831 7 057 7 382 (44.7)
Other machinery and equipment 14 482 15 447 24 756 11 104 12 112 11 883 12 338 15 003 10 818 3.8
Heritage Assets – – – – – – – – –
Specialised military assets – – – – – – – – –
Biological assets – 15 109 14 278 11 538 3 610 3 610 8 018 10 147 10 613 122.1
Land and sub-soil assets – – – – – – – – –
Software and other intangible assets – – – – – – – – –
Payments for financial assets – – – – – – – – –
Total economic classification 788 269 799 196 822 566 855 629 839 245 839 246 827 125 886 709 925 935 (1.4)
462