
Page 478 - Provincial Treasury Estimates.pdf
P. 478
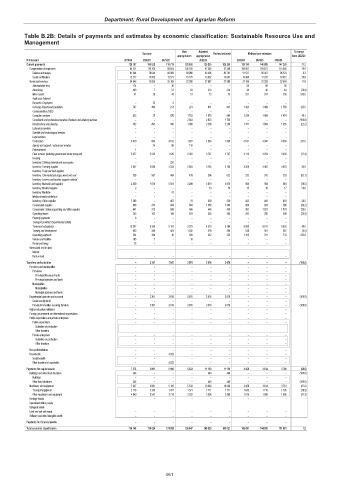
Department: Rural Development and Agrarian Reform
Table B.2B: Details of payments and estimates by economic classification: Sustainable Resource Use and
Management
Main Adjusted % change
Outcome Revised estimate Medium-term estimates
appropriation appropriation from 2022/23
R thousand 2019/20 2020/21 2021/22 2022/23 2023/24 2024/25 2025/26
Current payments 128 767 106 632 118 719 129 038 125 235 125 236 139 193 140 886 147 280 11.1
Compensation of employees 94 121 90 706 93 554 105 750 97 348 97 348 108 007 109 627 114 586 10.9
Salaries and wages 81 904 78 644 80 983 89 980 83 496 83 701 91 527 92 407 96 574 9.3
Social contributions 12 217 12 062 12 571 15 770 13 852 13 647 16 480 17 220 18 012 20.8
Goods and services 34 646 15 926 25 165 23 288 27 887 27 888 31 186 31 259 32 694 11.8
Administrative fees 174 – 30 – – – 84 88 92
Advertising 490 7 53 63 210 210 44 46 48 (79.0)
Minor assets 41 29 45 51 73 73 251 247 258 243.8
Audit cost: External – – – – – – – – –
Bursaries: Employees – 23 6 – – – – – –
Catering: Departmental activities 707 463 211 274 631 631 1 423 1 489 1 558 125.5
Communication (G&S) – – – – – – – – –
Computer services 623 35 870 1 703 1 078 864 1 254 1 409 1 474 45.1
Consultants and professional services: Business and advisory services – – – 2 923 2 923 1 738 – – – (100.0)
Infrastructure and planning 302 497 500 1 000 2 298 2 298 1 787 1 869 1 955 (22.2)
Laboratory services – – – – – – – – –
Scientific and technological services – – – – – – – – –
Legal services – – – – – – – – –
Contractors 3 619 603 4 512 1 927 1 639 1 639 5 531 4 360 4 560 237.5
Agency and support / outsourced services – 74 86 110 – – – – –
Entertainment 1 – – – – – – – –
Fleet services (including government motor transport) 3 077 3 245 1 635 2 022 3 767 3 767 3 113 3 254 3 403 (17.4)
Housing – – – – – – – – –
Inventory: Clothing material and accessories – – 220 – – – – – –
Inventory: Farming supplies 2 647 3 686 3 333 2 883 3 165 3 165 4 269 4 465 4 670 34.9
Inventory: Food and food supplies – – – – – – – – –
Inventory: Chemicals,fuel,oil,gas,wood and coal 336 567 404 439 596 622 232 242 253 (62.7)
Inventory: Learner and teacher support material – – – – – – – – –
Inventory: Materials and supplies 2 439 1 674 5 581 3 266 3 679 3 679 864 904 946 (76.5)
Inventory: Medical supplies 2 – – – 10 10 15 16 17 50.0
Inventory: Medicine – – 41 – – – – – –
Medsas inventory interface – – – – – – – – –
Inventory: Other supplies 7 286 – 407 70 339 339 422 441 461 24.5
Consumable supplies 658 413 884 684 1 388 1 388 886 924 966 (36.2)
Consumable: Stationery,printing and office supplies 641 373 508 565 456 430 987 1 031 1 079 129.5
Operating leases 243 162 188 378 355 355 282 295 308 (20.6)
Property payments 6 – – – – – – – –
Transport provided: Departmental activity – – – – – – – – –
Travel and subsistence 10 207 3 330 5 197 3 279 4 370 5 784 8 099 8 917 9 326 40.0
Training and development 683 340 424 1 242 578 564 538 561 587 (4.6)
Operating payments 224 398 30 399 332 332 1 105 701 733 232.8
Venues and facilities 165 7 – 10 – – – – –
Rental and hiring 75 – – – – – – – –
Interest and rent on land – – – – – – – – –
Interest – – – – – – – – –
Rent on land – – – – – – – – –
Transfers and subsidies – 2 301 7 641 3 676 3 676 3 676 – – – (100.0)
Provinces and municipalities – – – – – – – – –
Provinces – – – – – – – – –
Provincial Revenue Funds – – – – – – – – –
Provincial agencies and funds – – – – – – – – –
Municipalities – – – – – – – – –
Municipalities – – – – – – – – –
Municipal agencies and funds – – – – – – – – –
Departmental agencies and accounts – 2 301 3 618 3 676 3 676 3 676 – – – (100.0)
Social security funds – – – – – – – – –
Provide list of entities receiving transfers – 2 301 3 618 3 676 3 676 3 676 – – – (100.0)
Higher education institutions – – – – – – – – –
Foreign governments and international organisations – – – – – – – – –
Public corporations and private enterprises – – – – – – – – –
Public corporations – – – – – – – – –
Subsidies on production – – – – – – – – –
Other transfers – – – – – – – – –
Private enterprises – – – – – – – – –
Subsidies on production – – – – – – – – –
Other transfers – – – – – – – – –
Non-profit institutions – – – – – – – – –
Households – – 4 023 – – – – – –
Social benefits – – – – – – – – –
Other transfers to households – – 4 023 – – – – – –
Payments for capital assets 7 373 5 891 5 195 5 333 11 109 11 109 3 458 3 614 3 781 (68.9)
Buildings and other fixed structures 346 – – – 440 440 – – – (100.0)
Buildings – – – – – – – – –
Other fixed structures 346 – – – 440 440 – – – (100.0)
Machinery and equipment 7 027 5 891 5 195 5 333 10 669 10 669 3 458 3 614 3 781 (67.6)
Transport equipment 2 178 2 350 1 477 1 571 7 771 7 771 1 642 1 716 1 795 (78.9)
Other machinery and equipment 4 849 3 541 3 718 3 762 2 898 2 898 1 816 1 898 1 986 (37.3)
Heritage Assets – – – – – – – – –
Specialised military assets – – – – – – – – –
Biological assets – – – – – – – – –
Land and sub-soil assets – – – – – – – – –
Software and other intangible assets – – – – – – – – –
Payments for financial assets – – – – – – – – –
Total economic classification 136 140 114 824 131 555 138 047 140 020 140 021 142 651 144 500 151 061 1.9
461