
Page 525 - Provincial Treasury Estimates.pdf
P. 525
Estimates of the Provincial Revenue and Expenditure (EPRE) – 2023/24 Financial Year
Table 18: Summary of payments and estimates by economic classification: P2 - Economic Development and Tourism
Main Adjusted
Outcome Revised estimate Medium-term estimates % change from
appropriation appropriation 2022/23
R thousand 2019/20 2020/21 2021/22 2022/23 2023/24 2024/25 2025/26
Current payments 69 812 62 774 69 524 84 951 100 057 100 057 87 574 90 848 87 676 (12.5)
Compensation of employees 57 902 55 209 58 190 71 985 74 576 74 576 70 452 73 798 75 273 (5.5)
Goods and services 11 910 7 565 11 334 12 966 25 481 25 481 17 122 17 050 12 403 (32.8)
Interest and rent on land – – – – – – – – –
Transfers and subsidies to: 708 968 733 303 779 229 662 213 705 001 705 001 1 330 860 1 192 256 1 410 728 88.8
Provinces and municipalities – – – 300 800 800 200 209 – (75.0)
Departmental agencies and accounts 707 188 711 148 771 223 646 316 688 604 688 604 1 316 060 1 177 447 1 396 128 91.1
Higher education institutions – – – – – – – – –
Foreign governments and international organisations – – – – – – – – –
Public corporations and private enterprises 1 780 22 155 8 006 15 597 15 597 15 597 14 600 14 600 14 600 (6.4)
Non-profit institutions – – – – – – – – –
Households – – – – – – – – –
Payments for capital assets – 7 765 – – – – – – –
Buildings and other fixed structures – 7 445 – – – – – – –
Machinery and equipment – – – – – – – – –
Heritage Assets – – – – – – – – –
Specialised military assets – – – – – – – – –
Biological assets – – – – – – – – –
Land and sub-soil assets – – – – – – – – –
Software and other intangible assets – 320 – – – – – – –
Payments for financial assets – – – – – – – – –
Total economic classification 778 780 803 842 848 753 747 164 805 058 805 058 1 418 434 1 283 104 1 498 404 76.2
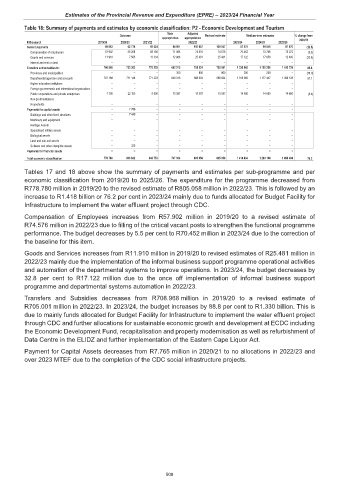
Tables 17 and 18 above show the summary of payments and estimates per sub-programme and per
economic classification from 2019/20 to 2025/26. The expenditure for the programme decreased from
R778.780 million in 2019/20 to the revised estimate of R805.058 million in 2022/23. This is followed by an
increase to R1.418 billion or 76.2 per cent in 2023/24 mainly due to funds allocated for Budget Facility for
Infrastructure to implement the water effluent project through CDC.
Compensation of Employees increases from R57.902 million in 2019/20 to a revised estimate of
R74.576 million in 2022/23 due to filling of the critical vacant posts to strengthen the functional programme
performance. The budget decreases by 5.5 per cent to R70.452 million in 2023/24 due to the correction of
the baseline for this item.
Goods and Services increases from R11.910 million in 2019/20 to revised estimates of R25.481 million in
2022/23 mainly due the implementation of the informal business support programme operational activities
and automation of the departmental systems to improve operations. In 2023/24, the budget decreases by
32.8 per cent to R17.122 million due to the once off implementation of informal business support
programme and departmental systems automation in 2022/23.
Transfers and Subsidies decreases from R708.968 million in 2019/20 to a revised estimate of
R705.001 million in 2022/23. In 2023/24, the budget increases by 88.8 per cent to R1.330 billion. This is
due to mainly funds allocated for Budget Facility for Infrastructure to implement the water effluent project
through CDC and further allocations for sustainable economic growth and development at ECDC including
the Economic Development Fund, recapitalisation and property modernisation as well as refurbishment of
Data Centre in the ELIDZ and further implementation of the Eastern Cape Liquor Act.
Payment for Capital Assets decreases from R7.765 million in 2020/21 to no allocations in 2022/23 and
over 2023 MTEF due to the completion of the CDC social infrastructure projects.
508