
Page 527 - Provincial Treasury Estimates.pdf
P. 527
Estimates of the Provincial Revenue and Expenditure (EPRE) – 2023/24 Financial Year
Table 20: Summary of payments and estimates by sub-programme: P3 - Environmental Affairs
Main Adjusted
Outcome Revised estimate Medium-term estimates % change from
appropriation appropriation 2022/23
R thousand 2019/20 2020/21 2021/22 2022/23 2023/24 2024/25 2025/26
1. Environmental Policy, Planning and Coordination 31 571 33 873 47 199 40 941 39 507 36 917 38 749 36 366 30 465 5.0
2. Compliance and Enforcement 51 176 48 513 49 944 50 837 43 763 32 119 33 219 35 686 35 454 3.4
3. Environmental Quality Management 21 354 20 148 20 418 28 317 25 119 27 019 28 182 30 398 28 719 4.3
4. Biodiversity Management 219 714 228 245 239 639 212 207 242 994 253 329 241 574 251 193 260 897 (4.6)
5. Environmental Empowerment Services 12 899 9 379 11 233 9 873 10 005 12 004 11 621 12 110 11 431 (3.2)
Total payments and estimates 336 714 340 158 368 433 342 175 361 388 361 388 353 345 365 753 366 966 (2.2)
Table 21: Summary of payments and estimates by economic classification: P3 - Environmental Affairs
Main Adjusted
Outcome Revised estimate Medium-term estimates % change from
appropriation appropriation
R thousand 2019/20 2020/21 2021/22 2022/23 2023/24 2024/25 2025/26 2022/23
Current payments 100 193 89 863 94 535 109 247 108 293 108 293 119 945 125 864 123 211 10.8
Compensation of employees 87 823 85 112 87 093 94 834 97 425 97 425 102 919 107 605 109 716 5.6
Goods and services 12 370 4 751 7 442 14 413 10 868 10 868 17 026 18 259 13 495 56.7
Interest and rent on land – – – – – – – – –
Transfers and subsidies to: 236 521 250 217 273 731 232 878 253 045 253 045 233 400 239 889 243 755 (7.8)
Provinces and municipalities 18 956 23 918 36 968 25 600 25 600 25 600 23 550 20 832 16 765 (8.0)
Departmental agencies and accounts 216 046 226 299 236 763 207 278 227 445 227 445 208 050 217 257 226 990 (8.5)
Higher education institutions – – – – – – – – –
Foreign governments and international organisations – – – – – – – – –
Public corporations and private enterprises – – – – – – – – –
Non-profit institutions 1 427 – – – – – 1 800 1 800 –
Households 92 – – – – – – – –
Payments for capital assets – 78 167 50 50 50 – – – (100.0)
Buildings and other fixed structures – – – – – – – – –
Machinery and equipment – 78 167 50 50 50 – – – (100.0)
Heritage Assets – – – – – – – – –
Specialised military assets – – – – – – – – –
Biological assets – – – – – – – – –
Land and sub-soil assets – – – – – – – – –
Software and other intangible assets – – – – – – – – –
Payments for financial assets – – – – – – – – –
Total economic classification 336 714 340 158 368 433 342 175 361 388 361 388 353 345 365 753 366 966 (2.2)
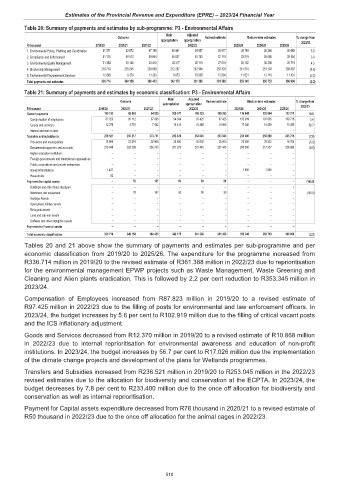
Tables 20 and 21 above show the summary of payments and estimates per sub-programme and per
economic classification from 2019/20 to 2025/26. The expenditure for the programme increased from
R336.714 million in 2019/20 to the revised estimate of R361.388 million in 2022/23 due to reprioritisation
for the environmental management EPWP projects such as Waste Management, Waste Greening and
Cleaning and Alien plants eradication. This is followed by 2.2 per cent reduction to R353.345 million in
2023/24.
Compensation of Employees increased from R87.823 million in 2019/20 to a revised estimate of
R97.425 million in 2022/23 due to the filling of posts for environmental and law enforcement officers. In
2023/24, the budget increases by 5.6 per cent to R102.919 million due to the filling of critical vacant posts
and the ICS inflationary adjustment.
Goods and Services decreased from R12.370 million in 2019/20 to a revised estimate of R10.868 million
in 2022/23 due to internal reprioritisation for environmental awareness and education of non-profit
institutions. In 2023/24, the budget increases by 56.7 per cent to R17.026 million due the implementation
of the climate change projects and development of the plans for Wetlands programmes.
Transfers and Subsidies increased from R236.521 million in 2019/20 to R253.045 million in the 2022/23
revised estimates due to the allocation for biodiversity and conservation at the ECPTA. In 2023/24, the
budget decreases by 7.8 per cent to R233.400 million due to the once off allocation for biodiversity and
conservation as well as internal reprioritisation.
Payment for Capital assets expenditure decreased from R78 thousand in 2020/21 to a revised estimate of
R50 thousand in 2022/23 due to the once off allocation for the animal cages in 2022/23.
510