Page 561 - Provincial Treasury Estimates.pdf
P. 561

Estimates of the Provincial Revenue and Expenditure (EPRE) – 2023/24  Financial Year
           x     Mechanical provides an efficient plant fleet in support of in-house construction and maintenance

                 unit.

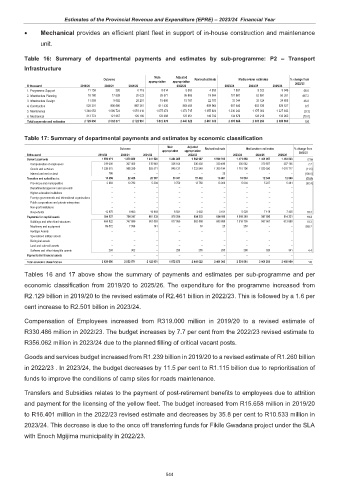
           Table  16:  Summary of departmental payments and estimates by sub-programme:  P2 – Transport
           Infrastructure

                                                         Main   Adjusted
                                       Outcome                         Revised estimate  Medium-term estimates  % change from
                                                       appropriation  appropriation
            R thousand         2019/20  2020/21  2021/22         2022/23          2023/24  2024/25  2025/26  2022/23
            1. Programme Support                    11 159                       280                     6 719                     8 814                     8 863                     4 853                     7 697                     9 522                     9 949  58.6
            2. Infrastracture Planning                    18 780                   17 528                   20 022                   39 371                   35 869                   18 064                 107 887                   52 891                   55 261  497.3
            3. Infrastructure Design                    11 589                     9 692                   28 251                   15 688                   15 767                   22 707                   33 344                   33 124                   34 608  46.8
            4. Construction                  528 301                 806 680                 887 361                 611 436                 883 458                 909 964                 987 646                 602 535                 629 527  8.5
            5. Maintanance                1 346 053              1 096 724              1 051 418              1 075 474              1 373 715              1 355 924              1 230 243              1 175 003              1 227 643  (9.3)
            6. Mechanical                    213 774                 121 667                 129 180                 122 088                 122 951                 149 792                 134 876                 128 218                 133 962  (10.0)
            Total payments and estimates               2 129 656              2 052 571              2 122 951              1 872 870              2 440 622              2 461 303              2 501 694              2 001 293              2 090 950  1.6

           Table 17: Summary of departmental payments and estimates by economic classification
                                                             Main    Adjusted
                                             Outcome                       Revised estimate  Medium-term estimates  % change from
                                                            appropriation  appropriation                    2022/23
            R thousand               2019/20  2020/21  2021/22       2022/23         2023/24  2024/25  2025/26
            Current payments                    1 559 071              1 273 859              1 241 520              1 284 285              1 568 987              1 590 703              1 471 858              1 401 057              1 463 823  (7.5)
             Compensation of employees                   319 000                 307 460                 315 949                 336 164                 336 438                 330 486                 356 062                 370 507                 387 106  7.7
             Goods and services                 1 239 875                 966 399                 925 571                 948 121              1 232 549              1 260 194              1 115 796              1 030 550              1 076 717  (11.5)
             Interest and rent on land                         196                           –                           –                           –                           –                         23                           –                           –                           –  (100.0)
            Transfers and subsidies to:                    15 658                   22 465                   20 197                   10 331                   17 432                   16 401                   10 533                   12 343                   12 896  (35.8)
             Provinces and municipalities                       2 983                   13 782                     5 204                     3 750                   13 750                   13 300                     5 004                     5 227                     5 461  (62.4)
                                                                                                         –
             Departmental agencies and accounts                            –                           –                           –                           –                           –                           –                           –                           –
             Higher education institutions                            –                           –                           –                           –                           –                           –                           –                           –
                                                                                                         –
                                                                                                         –
             Foreign governments and international organisations                           –                           –                           –                           –                           –                           –                           –                           –
                                                                                                         –
             Public corporations and private enterprises                            –                           –                           –                           –                           –                           –                           –                           –
                                                                                                         –
             Non-profit institutions                            –                           –                           –                           –                           –                           –                           –                           –
             Households                              12 675                     8 683                   14 993                     6 581                     3 682                     3 101                     5 529                     7 116                     7 435  78.3
            Payments for capital assets                  554 927                 756 247                 861 235                 578 254                 854 203                 854 199              1 019 303                 587 893                 614 231  19.3
             Buildings and other fixed structures                  464 822                 747 886                 861 093                 577 955                 853 888                 853 888              1 018 755                 587 567                 613 890  19.3
             Machinery and equipment                    89 872                     7 999                       141                           –                         30                         25                       250                           –                           –  889.7
                                                                                                         –
             Heritage Assets                                 –                           –                           –                           –                           –                           –                           –                           –
             Specialised military assets                            –                           –                           –                           –                           –                           –                           –                           –
                                                                                                         –
                                                                                                         –
             Biological assets                               –                           –                           –                           –                           –                           –                           –                           –
                                                                                                         –
             Land and sub-soil assets                            –                           –                           –                           –                           –                           –                           –                           –
             Software and other intangible assets                        233                       362                           –                       299                       285                       285                       298                       326                       341  4.4
                                                                                                         –
            Payments for financial assets                            –                           –                           –                           –                           –                           –                           –                           –
            Total economic classification               2 129 656              2 052 571              2 122 951              1 872 870              2 440 622              2 461 303              2 501 694              2 001 293              2 090 950  1.6
           Tables 16 and 17 above show the summary of payments and estimates per sub-programme and per
           economic classification from 2019/20 to 2025/26. The expenditure for the programme increased  from
           R2.129 billion in 2019/20 to the revised estimate of R2.461 billion in 2022/23. This is followed by a 1.6 per
           cent increase to R2.501 billion in 2023/24.
           Compensation of Employees increased  from  R319.000 million in 2019/20 to a revised estimate of
           R330.486 million in 2022/23. The budget increases by 7.7 per cent from the 2022/23 revised estimate to
           R356.062 million in 2023/24 due to the planned filling of critical vacant posts.

           Goods and services budget increased from R1.239 billion in 2019/20 to a revised estimate of R1.260 billion

           in 2022/23 . In 2023/24, the budget decreases by 11.5 per cent to R1.115 billion due to reprioritisation of
           funds to improve the conditions of camp sites for roads maintenance.

           Transfers and Subsidies relates to the payment of post-retirement benefits to employees due to attrition

           and payment for the licensing of the yellow fleet. The budget increased from R15.658 million in 2019/20
           to R16.401 million in the 2022/23 revised estimate and decreases by 35.8 per cent to R10.533 million in

           2023/24. This decrease is due to the once off transferring funds for Fikile Gwadana project under the SLA
           with Enoch Mgijima municipality in 2022/23.


                                                             544
   556   557   558   559   560   561   562   563   564   565   566