
Page 563 - Provincial Treasury Estimates.pdf
P. 563
Estimates of the Provincial Revenue and Expenditure (EPRE) – 2023/24 Financial Year
x Operator Permits and Licensing manages the approval and control of registering of transport
operations and issuing of all licenses and permits required in terms of legislation.
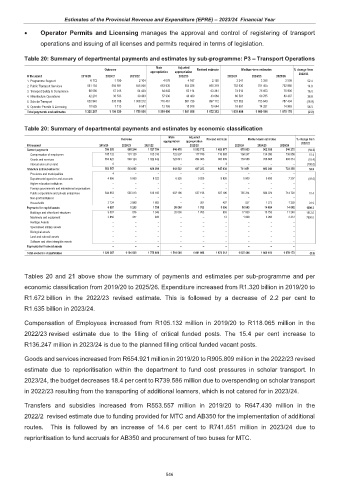
Table 20: Summary of departmental payments and estimates by sub-programme: P3 – Transport Operations
Main Adjusted
Outcome Revised estimate Medium-term estimates % change from
appropriation appropriation
R thousand 2019/20 2020/21 2021/22 2022/23 2023/24 2024/25 2025/26 2022/23
1. Programme Support 6 772 1 199 2 104 4 076 4 167 2 193 3 341 3 358 3 508 52.4
2. Public Transport Services 561 154 554 591 645 066 653 935 654 226 655 319 752 930 701 454 732 880 14.9
3. Transport Safety & Compliance 66 590 57 315 54 439 64 842 62 114 63 381 74 013 75 653 75 936 16.8
4. Infrastructure Operations 42 281 38 533 39 403 57 930 48 489 43 664 60 591 60 765 63 487 38.8
5. Scholar Transport 632 945 535 788 1 008 212 716 461 881 726 897 112 727 952 753 643 787 404 (18.9)
6. Operator Permits & Licencing 10 525 7 113 6 581 12 756 10 976 10 644 16 657 14 321 14 963 56.5
Total payments and estimates 1 320 267 1 194 539 1 755 806 1 510 000 1 661 698 1 672 312 1 635 484 1 609 194 1 678 178 (2.2)
Table 20: Summary of departmental payments and estimates by economic classification
Main Adjusted
Outcome Revised estimate Medium-term estimates % change from
appropriation appropriation 2022/23
R thousand 2019/20 2020/21 2021/22 2022/23 2023/24 2024/25 2025/26
Current payments 760 053 650 244 1 127 760 846 478 1 012 712 1 023 877 875 833 902 926 940 270 (14.5)
Compensation of employees 105 132 101 120 105 318 122 837 117 749 118 065 136 247 134 058 136 956 15.4
Goods and services 654 921 549 124 1 022 442 723 641 894 963 905 809 739 586 768 868 803 314 (18.4)
Interest and rent on land 0 – – – – 3 – – – (100.0)
Transfers and subsidies to: 553 557 543 062 626 290 643 522 647 223 647 430 741 651 692 244 723 256 14.6
Provinces and municipalities 4 – – – – – – – –
Departmental agencies and accounts 4 956 5 069 8 322 6 326 9 826 9 826 5 800 6 898 7 207 (41.0)
Higher education institutions – – – – – – – – –
Foreign governments and international organisations – – – – – – – – –
Public corporations and private enterprises 544 863 535 013 616 165 637 196 637 196 637 196 735 314 684 074 714 720 15.4
Non-profit institutions – – – – – – – – –
Households 3 734 2 980 1 803 – 201 407 537 1 272 1 329 31.9
Payments for capital assets 6 657 1 233 1 755 20 000 1 763 1 006 18 000 14 024 14 652 1690.2
Buildings and other fixed structures 3 007 876 1 349 20 000 1 763 993 17 000 10 758 11 240 1612.0
Machinery and equipment 3 650 357 406 – – 13 1 000 3 266 3 412 7900.0
Heritage Assets – – – – – – – – –
Specialised military assets – – – – – – – – –
Biological assets – – – – – – – – –
Land and sub-soil assets – – – – – – – – –
Software and other intangible assets – – – – – – – – –
Payments for financial assets – – – – – – – – –
Total economic classification 1 320 267 1 194 539 1 755 806 1 510 000 1 661 698 1 672 312 1 635 484 1 609 194 1 678 178 (2.2)
Tables 20 and 21 above show the summary of payments and estimates per sub-programme and per
economic classification from 2019/20 to 2025/26. Expenditure increased from R1.320 billion in 2019/20 to
R1.672 billion in the 2022/23 revised estimate. This is followed by a decrease of 2.2 per cent to
R1.635 billion in 2023/24.
Compensation of Employees increased from R105.132 million in 2019/20 to R118.065 million in the
2022/23 revised estimate due to the filling of critical funded posts. The 15.4 per cent increase to
R136.247 million in 2023/24 is due to the planned filling critical funded vacant posts.
Goods and services increased from R654.921 million in 2019/20 to R905.809 million in the 2022/23 revised
estimate due to reprioritisation within the department to fund cost pressures in scholar transport. In
2023/24, the budget decreases 18.4 per cent to R739.586 million due to overspending on scholar transport
in 2022/23 resulting from the transporting of additional learners, which is not catered for in 2023/24.
Transfers and subsidies increased from R553.557 million in 2019/20 to R647.430 million in the
2022/2 revised estimate due to funding provided for MTC and AB350 for the implementation of additional
routes. This is followed by an increase of 14.6 per cent to R741.651 million in 2023/24 due to
reprioritisation to fund accruals for AB350 and procurement of two buses for MTC.
546