
Page 565 - Provincial Treasury Estimates.pdf
P. 565
Estimates of the Provincial Revenue and Expenditure (EPRE) – 2023/24 Financial Year
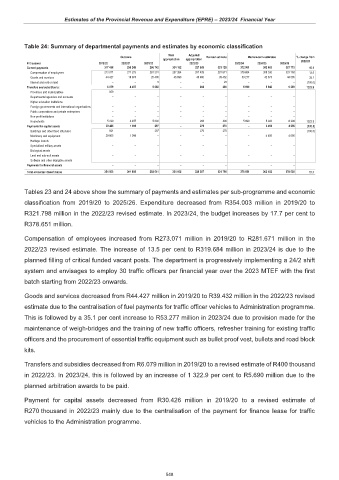
Table 24: Summary of departmental payments and estimates by economic classification
Main Adjusted
Outcome Revised estimate Medium-term estimates % change from
appropriation appropriation 2022/23
R thousand 2019/20 2020/21 2021/22 2022/23 2023/24 2024/25 2025/26
Current payments 317 498 296 249 286 742 334 162 327 909 321 128 372 961 352 003 367 773 16.1
Compensation of employees 273 071 277 275 261 331 287 264 281 429 281 671 319 684 309 330 323 188 13.5
Goods and services 44 427 18 974 25 406 46 898 46 480 39 432 53 277 42 673 44 585 35.1
Interest and rent on land – – 5 – – 25 – – – (100.0)
Transfers and subsidies to: 6 079 4 457 5 602 – 208 400 5 690 5 943 6 209 1322.9
Provinces and municipalities 859 – – – – – – – –
Departmental agencies and accounts – – – – – – – – –
Higher education institutions – – – – – – – – –
Foreign governments and international organisations – – – – – – – – –
Public corporations and private enterprises – – – – – – – – –
Non-profit institutions – – – – – – – – –
Households 5 220 4 457 5 602 – 208 400 5 690 5 943 6 209 1322.9
Payments for capital assets 30 426 1 099 297 – 270 270 – 4 456 4 656 (100.0)
Buildings and other fixed structures 621 – 297 – 270 270 – – – (100.0)
Machinery and equipment 29 805 1 099 – – – – – 4 456 4 656
Heritage Assets – – – – – – – – –
Specialised military assets – – – – – – – – –
Biological assets – – – – – – – – –
Land and sub-soil assets – – – – – – – – –
Software and other intangible assets – – – – – – – – –
Payments for financial assets – – – – – – – – –
Total economic classification 354 003 301 805 292 641 334 162 328 387 321 798 378 651 362 402 378 638 17.7
Tables 23 and 24 above show the summary of payments and estimates per sub-programme and economic
classification from 2019/20 to 2025/26. Expenditure decreased from R354.003 million in 2019/20 to
R321.798 million in the 2022/23 revised estimate. In 2023/24, the budget increases by 17.7 per cent to
R378.651 million.
Compensation of employees increased from R273.071 million in 2019/20 to R281.671 million in the
2022/23 revised estimate. The increase of 13.5 per cent to R319.684 million in 2023/24 is due to the
planned filling of critical funded vacant posts. The department is progressively implementing a 24/2 shift
system and envisages to employ 30 traffic officers per financial year over the 2023 MTEF with the first
batch starting from 2022/23 onwards.
Goods and services decreased from R44.427 million in 2019/20 to R39.432 million in the 2022/23 revised
estimate due to the centralisation of fuel payments for traffic officer vehicles to Administration programme.
This is followed by a 35.1 per cent increase to R53.277 million in 2023/24 due to provision made for the
maintenance of weigh-bridges and the training of new traffic officers, refresher training for existing traffic
officers and the procurement of essential traffic equipment such as bullet proof vest, bullets and road block
kits.
Transfers and subsidies decreased from R6.079 million in 2019/20 to a revised estimate of R400 thousand
in 2022/23. In 2023/24, this is followed by an increase of 1 322.9 per cent to R5.690 million due to the
planned arbitration awards to be paid.
Payment for capital assets decreased from R30.426 million in 2019/20 to a revised estimate of
R270 thousand in 2022/23 mainly due to the centralisation of the payment for finance lease for traffic
vehicles to the Administration programme.
548