
Page 567 - Provincial Treasury Estimates.pdf
P. 567
Estimates of the Provincial Revenue and Expenditure (EPRE) – 2023/24 Financial Year
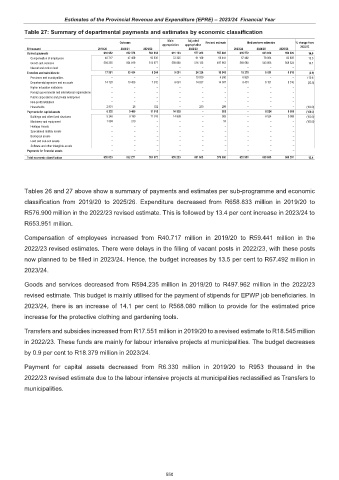
Table 27: Summary of departmental payments and estimates by economic classification
Main Adjusted
Outcome Revised estimate Medium-term estimates % change from
appropriation appropriation 2022/23
R thousand 2019/20 2020/21 2021/22 2022/23 2023/24 2024/25 2025/26
Current payments 634 952 612 378 564 814 631 193 577 282 557 403 635 572 623 020 650 929 14.0
Compensation of employees 40 717 47 459 50 836 72 325 61 159 59 441 67 492 79 064 82 605 13.5
Goods and services 594 235 564 919 513 977 558 868 516 123 497 962 568 080 543 956 568 324 14.1
Interest and rent on land – – – – – – – – –
Transfers and subsidies to: 17 551 10 484 8 244 9 091 24 326 18 545 18 379 8 151 8 516 (0.9)
Provinces and municipalities – – – – 10 039 4 240 8 928 – – 110.6
Departmental agencies and accounts 14 720 10 458 7 912 9 091 14 037 14 007 9 451 8 151 8 516 (32.5)
Higher education institutions – – – – – – – – –
Foreign governments and international organisations – – – – – – – – –
Public corporations and private enterprises – – – – – – – – –
Non-profit institutions – – – – – – – – –
Households 2 831 26 332 – 250 298 – – – (100.0)
Payments for capital assets 6 330 9 409 11 915 14 939 – 953 – 8 524 8 906 (100.0)
Buildings and other fixed structures 5 246 9 190 11 915 14 939 – 903 – 8 524 8 906 (100.0)
Machinery and equipment 1 084 219 – – – 50 – – – (100.0)
Heritage Assets – – – – – – – – –
Specialised military assets – – – – – – – – –
Biological assets – – – – – – – – –
Land and sub-soil assets – – – – – – – – –
Software and other intangible assets – – – – – – – – –
Payments for financial assets – – – – – – – – –
Total economic classification 658 833 632 271 584 973 655 223 601 608 576 900 653 951 639 695 668 351 13.4
Tables 26 and 27 above show a summary of payments and estimates per sub-programme and economic
classification from 2019/20 to 2025/26. Expenditure decreased from R658.833 million in 2019/20 to
R576.900 million in the 2022/23 revised estimate. This is followed by 13.4 per cent increase in 2023/24 to
R653.951 million.
Compensation of employees increased from R40.717 million in 2019/20 to R59.441 million in the
2022/23 revised estimates. There were delays in the filling of vacant posts in 2022/23, with these posts
now planned to be filled in 2023/24. Hence, the budget increases by 13.5 per cent to R67.492 million in
2023/24.
Goods and services decreased from R594.235 million in 2019/20 to R497.962 million in the 2022/23
revised estimate. This budget is mainly utilised for the payment of stipends for EPWP job beneficiaries. In
2023/24, there is an increase of 14.1 per cent to R568.080 million to provide for the estimated price
increase for the protective clothing and gardening tools.
Transfers and subsidies increased from R17.551 million in 2019/20 to a revised estimate to R18.545 million
in 2022/23. These funds are mainly for labour intensive projects at municipalities. The budget decreases
by 0.9 per cent to R18.379 million in 2023/24.
Payment for capital assets decreased from R6.330 million in 2019/20 to R953 thousand in the
2022/23 revised estimate due to the labour intensive projects at municipalities reclassified as Transfers to
municipalities.
550