Page 572 - Provincial Treasury Estimates.pdf
P. 572

Department: of Transport
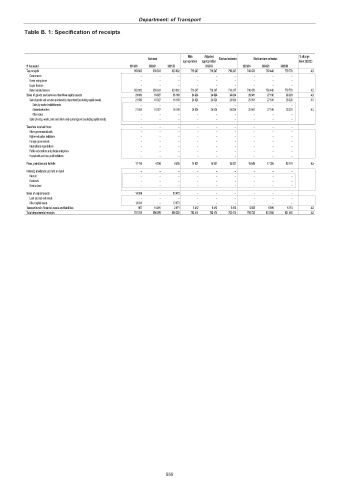
           Table B. 1: Specification of receipts


                                                                     Main   Adjusted                        % change
                                                       Outcome                  Revised estimate  Medium-term estimates
                                                                   appropriation  appropriation             from 2022/23
            R thousand                          2019/20  2020/21  2021/22  2022/23      2023/24  2024/25  2025/26
            Tax receipts                                       653 803                 659 833                 623 082                 716 247                 716 247                 716 247                 748 478                 763 448                 778 778  4.5
             Casino taxes                           –      –     –      –      –     –      –     –      –
             Horse racing taxes                     –      –     –      –      –     –      –     –      –
             Liquor licences                        –      –     –      –      –     –      –     –      –
             Motor vehicle licences                            653 803                 659 833                 623 082                 716 247                 716 247                 716 247                 748 478                 763 448                 778 778  4.5
            Sales of goods and services other than capital assets                    21 659                   18 027                   16 189                   24 824                   24 824                   24 824                   25 941                   27 106                   28 320  4.5
             Sale of goods and services produced by department (excluding capital assets)                    21 659                   18 027                   16 189                   24 824                   24 824                   24 824                   25 941                   27 106                   28 320  4.5
              Sales by market establishments        –      –     –      –      –     –      –     –      –
              Administrative fees                                21 659                   18 027                   16 189                   24 824                   24 824                   24 824                   25 941                   27 106                   28 320  4.5
              Other sales                           –      –     –      –      –     –      –     –      –
             Sales of scrap, waste, arms and other used current goods (excluding capital assets)  –  –  –  –  –  –  –  –  –
            Transfers received from:                –      –     –      –      –     –      –     –      –
             Other governmental units               –      –     –      –      –     –      –     –      –
             Higher education institutions          –      –     –      –      –     –      –     –      –
             Foreign governments                    –      –     –      –      –     –      –     –      –
             International organisations            –      –     –      –      –     –      –     –      –
             Public corporations and private enterprises  –  –   –      –      –     –      –     –      –
             Households and non-profit institutions  –     –     –      –      –     –      –     –      –
            Fines, penalties and forfeits                        11 116                     4 198                     4 505                   15 931                   15 931                   15 931                   16 648                   17 395                   18 174  4.5
            Interest, dividends and rent on land    –      –     –      –      –     –      –     –      –
             Interest                               –      –     –      –      –     –      –     –      –
             Dividends                              –      –     –      –      –     –      –     –      –
             Rent on land                           –      –     –      –      –     –      –     –      –
            Sales of capital assets                              14 034  –  13 473  –  –  –  –    –      –
             Land and sub-soil assets               –      –     –      –      –     –      –     –      –
             Other capital assets                                14 034  –  13 473  –  –  –  –    –      –
            Transactions in financial assets and liabilities                         907                   14 001                     2 071                     5 412                     5 412                     5 412                     5 655                     5 909                     6 174  4.5
            Total departmental receipts                        701 519                 696 059                 659 320                 762 414                 762 414                 762 414                 796 722                 813 858                 831 446  4.5


                                                             555
   567   568   569   570   571   572   573   574   575   576   577