
Page 604 - Provincial Treasury Estimates.pdf
P. 604
Department: +XPDQ 6HWWOHPHQWV
Table 16: Summary of departmental payments and estimates by economic classification: P3 – Housing
Development
Main Adjusted
Outcome Revised estimate Medium-term estimates % change from
appropriation appropriation
R thousand 2019/20 2020/21 2021/22 2022/23 2023/24 2024/25 2025/26 2022/23
Current payments 215 896 201 051 205 657 213 335 215 271 217 324 224 725 236 873 240 942 3.4
Compensation of employees 204 009 191 019 197 672 204 754 204 754 204 754 212 156 220 284 225 179 3.6
Goods and services 11 887 10 032 7 985 8 581 10 517 12 571 12 569 16 589 15 763 (0.0)
Interest and rent on land – – – – – – – – –
Transfers and subsidies to: 1 891 751 1 249 768 2 137 188 1 993 937 2 042 745 2 042 923 2 088 499 2 183 879 2 281 717 2.2
Provinces and municipalities – – – – – – – – –
Departmental agencies and accoun – – – – – – – – –
Higher education institutions – – – – – – – – –
Foreign governments and internatio – – – – – – – – –
Public corporations and private ent – – – – – – – – –
Non-profit institutions – – – – – – – – –
Households 1 891 751 1 249 768 2 137 188 1 993 937 2 042 745 2 042 923 2 088 499 2 183 879 2 281 717 2.2
Payments for capital assets -2 – – – – – – – –
Buildings and other fixed structures – – – – – – – – –
Machinery and equipment -2 – – – – – – – –
Heritage Assets – – – – – – – – –
Specialised military assets – – – – – – – – –
Biological assets – – – – – – – – –
Land and sub-soil assets – – – – – – – – –
Software and other intangible asset – – – – – – – – –
Payments for financial assets – – – – – – – – –
Total economic classification 2 107 645 1 450 819 2 342 845 2 207 272 2 258 016 2 260 247 2 313 224 2 420 752 2 522 659 2.3
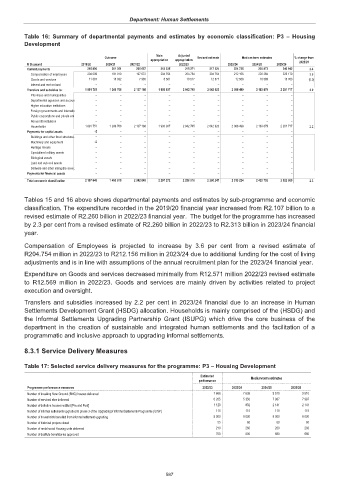
Tables 15 and 16 above shows departmental payments and estimates by sub-programme and economic
classification. The expenditure recorded in the 2019/20 financial year increased from R2.107 billion to a
revised estimate of R2.260 billion in 2022/23 financial year. The budget for the programme has increased
by 2.3 per cent from a revised estimate of R2.260 billion in 2022/23 to R2.313 billion in 2023/24 financial
year.
Compensation of Employees is projected to increase by 3.6 per cent from a revised estimate of
R204.754 million in 2022/23 to R212.156 million in 2023/24 due to additional funding for the cost of living
adjustments and is in line with assumptions of the annual recruitment plan for the 2023/24 financial year.
Expenditure on Goods and services decreased minimally from R12.571 million 2022/23 revised estimate
to R12.569 million in 2022/23. Goods and services are mainly driven by activities related to project
execution and oversight.
Transfers and subsidies increased by 2.2 per cent in 2023/24 financial due to an increase in Human
Settlements Development Grant (HSDG) allocation. Households is mainly comprised of the (HSDG) and
the Informal Settlements Upgrading Partnership Grant (ISUPG) which drive the core business of the
department in the creation of sustainable and integrated human settlements and the facilitation of a
programmatic and inclusive approach to upgrading informal settlements.
8.3.1 Service Delivery Measures
Table 17: Selected service delivery measures for the programme: P3 – Housing Development
Estimated
performance Medium-term estimates
Programme performance measures 2022/23 2023/24 2024/25 2025/26
Number of breaking New Ground (BNG) houses delivered 7 666 7 638 9 510 9 510
Number of serviced sites delivered 6 205 5 350 7 987 7 987
Number of defective houses rectified [Pre and Post] 1 120 832 2 141 2 141
Number of informal settlements upgraded to phase 3 of the Upgradingof Informal Settlements Programme (UISP) 115 115 115 115
Number of households benefited from informal settlement upgrading 8 000 8 000 8 000 8 000
Number of historical projecs closed 55 60 60 60
Number of rental social Housing units delivered 210 260 280 280
Number of destitute beneficiaries approved 700 800 650 650
587