
Page 601 - Provincial Treasury Estimates.pdf
P. 601
Estimates of the Provincial Revenue and Expenditure (EPRE) – 2023/24 Financial Year
Main Adjusted
Outcome Revised estimate Medium-term estimates % change from
appropriation appropriation 2022/23
R thousand 2019/20 2020/21 2021/22 2022/23 2023/24 2024/25 2025/26
1. Office Of The MEC 11 879 8 884 8 364 8 144 9 854 9 940 10 674 11 755 12 282 7.4
2. Corporate Services 146 550 136 569 143 348 167 262 182 152 182 602 167 201 186 707 153 287 (8.4)
Total payments and estimates 158 429 145 453 151 712 175 406 192 006 192 542 177 875 198 462 165 569 (7.6)
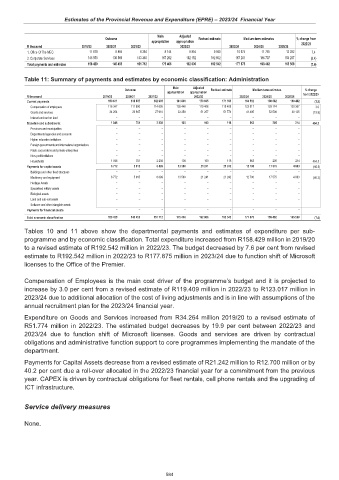
Table 11: Summary of payments and estimates by economic classification: Administration
Main Adjusted
Outcome Revised estimate Medium-term estimates % change
appropriation appropriation
R thousand 2019/20 2020/21 2021/22 2022/23 2023/24 2024/25 2025/26 from 2022/23
Current payments 150 611 138 837 142 605 161 806 170 665 171 183 164 512 180 682 160 492 (3.9)
Compensation of employees 116 347 111 890 114 695 128 448 119 408 119 409 123 017 128 174 130 367 3.0
Goods and services 34 264 26 947 27 910 33 358 51 257 51 774 41 495 52 508 30 125 (19.9)
Interest and rent on land – – – – – – – – –
Transfers and subsidies to: 1 046 701 2 208 100 100 118 663 205 214 464.3
Provinces and municipalities – – – – – – – – –
Departmental agencies and accounts – – – – – – – – –
Higher education institutions – – – – – – – – –
Foreign governments and international organisations – – – – – – – – –
Public corporations and private enterprises – – – – – – – – –
Non-profit institutions – – – – – – – – –
Households 1 046 701 2 208 100 100 118 663 205 214 464.3
Payments for capital assets 6 772 5 915 6 899 13 500 21 241 21 242 12 700 17 575 4 863 (40.2)
Buildings and other fixed structures – – – – – – – – –
Machinery and equipment 6 772 5 915 6 899 13 500 21 241 21 242 12 700 17 575 4 863 (40.2)
Heritage Assets – – – – – – – – –
Specialised military assets – – – – – – – – –
Biological assets – – – – – – – – –
Land and sub-soil assets – – – – – – – – –
Software and other intangible assets – – – – – – – – –
Payments for financial assets – – – – – – – – –
Total economic classification 158 429 145 453 151 712 175 406 192 006 192 542 177 875 198 462 165 569 (7.6)
Tables 10 and 11 above show the departmental payments and estimates of expenditure per sub-
programme and by economic classification. Total expenditure increased from R158.429 million in 2019/20
to a revised estimate of R192.542 million in 2022/23. The budget decreased by 7.6 per cent from revised
estimate to R192.542 million in 2022/23 to R177.875 million in 2023/24 due to function shift of Microsoft
licenses to the Office of the Premier.
Compensation of Employees is the main cost driver of the programme’s budget and it is projected to
increase by 3.0 per cent from a revised estimate of R119.409 million in 2022/23 to R123.017 million in
2023/24 due to additional allocation of the cost of living adjustments and is in line with assumptions of the
annual recruitment plan for the 2023/24 financial year.
Expenditure on Goods and Services increased from R34.264 million 2019/20 to a revised estimate of
R51.774 million in 2022/23. The estimated budget decreases by 19.9 per cent between 2022/23 and
2023/24 due to function shift of Microsoft licenses. Goods and services are driven by contractual
obligations and administrative function support to core programmes implementing the mandate of the
department.
Payments for Capital Assets decrease from a revised estimate of R21.242 million to R12.700 million or by
40.2 per cent due a roll-over allocated in the 2022/23 financial year for a commitment from the previous
year. CAPEX is driven by contractual obligations for fleet rentals, cell phone rentals and the upgrading of
ICT infrastructure.
Service delivery measures
None.
584