
Page 606 - Provincial Treasury Estimates.pdf
P. 606
Department: +XPDQ 6HWWOHPHQWV
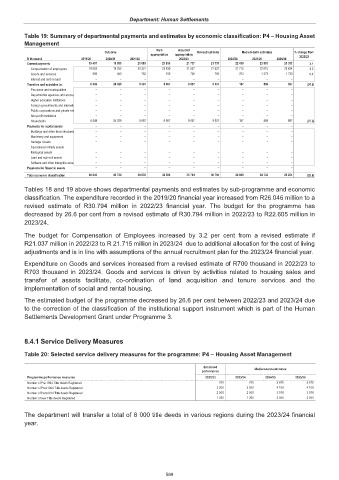
Table 19: Summary of departmental payments and estimates by economic classification: P4 – Housing Asset
Management
Main Adjusted
Outcome Revised estimate Medium-term estimates % change from
appropriation appropriation 2022/23
R thousand 2019/20 2020/21 2021/22 2022/23 2023/24 2024/25 2025/26
Current payments 19 497 19 695 21 083 23 939 21 737 21 737 22 418 23 883 25 357 3.1
Compensation of employees 18 603 19 252 20 331 23 839 21 037 21 037 21 715 22 610 23 624 3.2
Goods and services 894 443 752 100 700 700 703 1 273 1 733 0.4
Interest and rent on land – – – – – – – – –
Transfers and subsidies to: 6 549 24 029 9 587 8 657 9 057 9 057 187 859 897 (97.9)
Provinces and municipalities – – – – – – – – –
Departmental agencies and accoun – – – – – – – – –
Higher education institutions – – – – – – – – –
Foreign governments and internatio – – – – – – – – –
Public corporations and private ent – – – – – – – – –
Non-profit institutions – – – – – – – – –
Households 6 549 24 029 9 587 8 657 9 057 9 057 187 859 897 (97.9)
Payments for capital assets – – – – – – – – –
Buildings and other fixed structures – – – – – – – – –
Machinery and equipment – – – – – – – – –
Heritage Assets – – – – – – – – –
Specialised military assets – – – – – – – – –
Biological assets – – – – – – – – –
Land and sub-soil assets – – – – – – – – –
Software and other intangible asset – – – – – – – – –
Payments for financial assets – – – – – – – – –
Total economic classification 26 046 43 724 30 670 32 596 30 794 30 794 22 605 24 742 26 254 (26.6)
Tables 18 and 19 above shows departmental payments and estimates by sub-programme and economic
classification. The expenditure recorded in the 2019/20 financial year increased from R26.046 million to a
revised estimate of R30.794 million in 2022/23 financial year. The budget for the programme has
decreased by 26.6 per cent from a revised estimate of R30.794 million in 2022/23 to R22.605 million in
2023/24.
The budget for Compensation of Employees increased by 3.2 per cent from a revised estimate if
R21.037 million in 2022/23 to R 21.715 million in 2023/24 due to additional allocation for the cost of living
adjustments and is in line with assumptions of the annual recruitment plan for the 2023/24 financial year.
Expenditure on Goods and services increased from a revised estimate of R700 thousand in 2022/23 to
R703 thousand in 2023/24. Goods and services is driven by activities related to housing sales and
transfer of assets facilitate, co-ordination of land acquisition and tenure services and the
implementation of social and rental housing.
The estimated budget of the programme decreased by 26.6 per cent between 2022/23 and 2023/24 due
to the correction of the classification of the institutional support instrument which is part of the Human
Settlements Development Grant under Programme 3.
8.4.1 Service Delivery Measures
Table 20: Selected service delivery measures for the programme: P4 – Housing Asset Management
Estimated
performance Medium-term estimates
Programme performance measures 2022/23 2023/24 2024/25 2025/26
Number of Pre-1994 Tittle deeds Registered 750 750 3 675 3 675
Number of Post-1994 Tittle deeds Registered 3 500 3 500 4 109 4 109
Number of Post-2014 Tittle deeds Registered 2 500 2 500 3 016 3 016
Number of new Tittle deeds Registered 1 250 1 250 2 000 2 000
The department will transfer a total of 8 000 title deeds in various regions during the 2023/24 financial
year.
589