
Page 602 - Provincial Treasury Estimates.pdf
P. 602
Department: +XPDQ 6HWWOHPHQWV
8.2 Programme 2: Housing Needs, Research and Planning
Objectives: To facilitate and undertake housing delivery planning. It consists of four sub-programmes:
x Administration: to provide administrative and / or transversal project management service;
x Policy: to provide a regulatory framework for housing delivery, develop policy guidelines, Proclamation
of Acts and Amendments;
x Planning: to develop provincial multi – year housing delivery plans; to properly plan provincial multi –
year strategic housing plans by October each year; and
x Research: to conduct research on demand for housing.
Table 12: Summary of departmental payments and estimates sub-programme: P2 – Housing Needs,
Research and Planning
Main Adjusted
Outcome Revised estimate Medium-term estimates % change
appropriation appropriation from 2022/23
R thousand 2019/20 2020/21 2021/22 2022/23 2023/24 2024/25 2025/26
1. Administration 2 655 1 730 1 137 2 689 953 954 1 841 2 122 2 297 93.0
2. Policy 4 998 4 393 6 063 6 710 6 408 6 408 6 190 6 629 7 034 (3.4)
3. Planning 4 944 5 574 5 850 6 082 7 140 6 470 6 451 6 776 7 183 (0.3)
4. Research 6 569 6 764 6 758 6 975 5 995 7 216 7 016 7 515 7 956 (2.8)
Total payments and estimates 19 166 18 461 19 808 22 456 20 496 21 048 21 498 23 042 24 470 2.1
Table 13: Summary of departmental payments and estimates by economic classification: P2 – Housing
Needs, Research and Planning
Main Adjusted
Outcome Revised estimate Medium-term estimates % change
appropriation appropriation
R thousand 2019/20 2020/21 2021/22 2022/23 2023/24 2024/25 2025/26 from 2022/23
Current payments 19 166 18 240 19 385 22 356 19 576 20 849 21 268 22 906 24 328 2.0
Compensation of employees 18 533 17 993 18 967 21 856 18 576 19 807 20 570 21 638 22 611 3.9
Goods and services 633 247 418 500 1 000 1 042 698 1 268 1 717 (33.0)
Interest and rent on land – – – – – – – – –
Transfers and subsidies to: – 221 423 100 920 199 230 136 142 15.6
Provinces and municipalities – – – – – – – – –
Departmental agencies and accounts – – – – – – – – –
Higher education institutions – – – – – – – – –
Foreign governments and international organisations – – – – – – – – –
Public corporations and private enterprises – – – – – – – – –
Non-profit institutions – – – – – – – – –
Households – 221 423 100 920 199 230 136 142 15.6
Payments for capital assets – – – – – – – – –
Buildings and other fixed structures – – – – – – – – –
Machinery and equipment – – – – – – – – –
Heritage Assets – – – – – – – – –
Specialised military assets – – – – – – – – –
Biological assets – – – – – – – – –
Land and sub-soil assets – – – – – – – – –
Software and other intangible assets – – – – – – – – –
Payments for financial assets – – – – – – – – –
Total economic classification 19 166 18 461 19 808 22 456 20 496 21 048 21 498 23 042 24 470 2.1
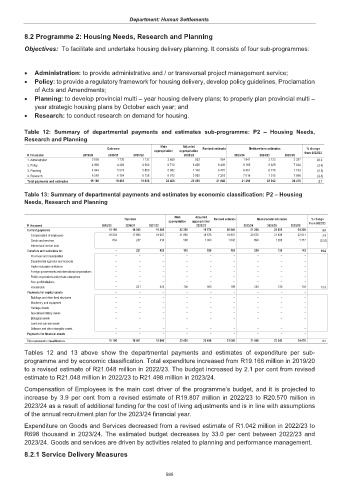
Tables 12 and 13 above show the departmental payments and estimates of expenditure per sub-
programme and by economic classification. Total expenditure increased from R19.166 million in 2019/20
to a revised estimate of R21.048 million in 2022/23. The budget increased by 2.1 per cent from revised
estimate to R21.048 million in 2022/23 to R21.498 million in 2023/24.
Compensation of Employees is the main cost driver of the programme’s budget, and it is projected to
increase by 3.9 per cent from a revised estimate of R19.807 million in 2022/23 to R20.570 million in
2023/24 as a result of additional funding for the cost of living adjustments and is in line with assumptions
of the annual recruitment plan for the 2023/24 financial year.
Expenditure on Goods and Services decreased from a revised estimate of R1.042 million in 2022/23 to
R698 thousand in 2023/24. The estimated budget decreases by 33.0 per cent between 2022/23 and
2023/24. Goods and services are driven by activities related to planning and performance management.
8.2.1 Service Delivery Measures
585