
Page 599 - Provincial Treasury Estimates.pdf
P. 599
Estimates of the Provincial Revenue and Expenditure (EPRE) – 2023/24 Financial Year
7.5 Infrastructure payments
7.5.1 Departmental infrastructure payments
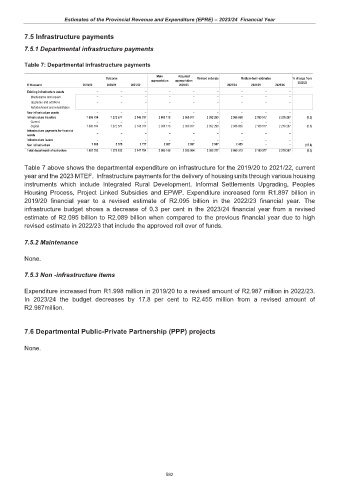
Table 7: Departmental infrastructure payments
Main Adjusted
Outcome Revised estimate Medium-term estimates % change from
appropriation appropriation 2022/23
R thousand 2019/20 2020/21 2021/22 2022/23 2023/24 2024/25 2025/26
Existing infrastructure assets – – – – – – – – –
Maintenance and repairs – – – – – – – – –
Upgrades and additions – – – – – – – – –
Refurbishment and rehabilitation – – – – – – – – –
New infrastructure assets – – – – – – – – –
Infrastructure transfers 1 895 704 1 272 577 2 145 017 2 000 173 2 050 917 2 092 290 2 086 858 2 180 577 2 278 267 (0.3)
Current – – – – – – – – –
Capital 1 895 704 1 272 577 2 145 017 2 000 173 2 050 917 2 092 290 2 086 858 2 180 577 2 278 267 (0.3)
Infrastructure payments for financial – – – – – – – – –
assets
Infrastructure leases – – – – – – – – –
Non infrastructure 1 998 2 575 2 777 2 987 2 987 2 987 2 455 – – (17.8)
Total department infrastructure 1 897 702 1 275 152 2 147 794 2 003 160 2 053 904 2 095 277 2 089 313 2 180 577 2 278 267 (0.3)
Table 7 above shows the departmental expenditure on infrastructure for the 2019/20 to 2021/22, current
year and the 2023 MTEF. Infrastructure payments for the delivery of housing units through various housing
instruments which include Integrated Rural Development, Informal Settlements Upgrading, Peoples
Housing Process, Project Linked Subsidies and EPWP. Expenditure increased form R1.897 billion in
2019/20 financial year to a revised estimate of R2.095 billion in the 2022/23 financial year. The
infrastructure budget shows a decrease of 0.3 per cent in the 2023/24 financial year from a revised
estimate of R2.095 billion to R2.089 billion when compared to the previous financial year due to high
revised estimate in 2022/23 that include the approved roll over of funds.
7.5.2 Maintenance
None.
7.5.3 Non -infrastructure items
Expenditure increased from R1.998 million in 2019/20 to a revised amount of R2.987 million in 2022/23.
In 2023/24 the budget decreases by 17.8 per cent to R2.455 million from a revised amount of
R2.987million.
7.6 Departmental Public-Private Partnership (PPP) projects
None.
582