
Page 719 - Provincial Treasury Estimates.pdf
P. 719
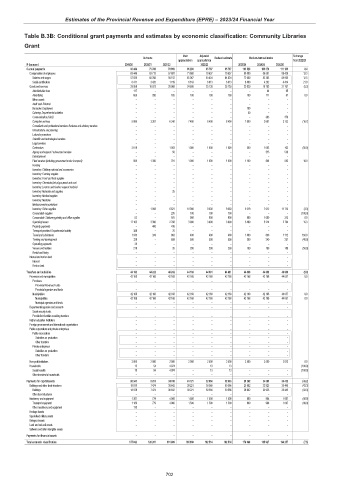
Estimates of the Provincial Revenue and Expenditure (EPRE) – 2023/24 Financial Year
Table B.3B: Conditional grant payments and estimates by economic classification: Community Libraries
Grant
Main Adjusted % change
Outcome Revised estimate Medium-term estimates
appropriation appropriation from 2022/23
R thousand 2019/20 2020/21 2021/22 2022/23 2023/24 2024/25 2025/26
Current payments 93 404 73 786 78 859 96 280 95 767 95 767 103 829 106 370 111 136 8.4
Compensation of employees 63 446 63 713 57 891 71 680 70 637 70 637 80 000 86 587 89 429 13.3
Salaries and wages 57 029 60 288 56 152 65 067 64 024 64 024 72 000 82 305 84 955 12.5
Social contributions 6 417 3 425 1 739 6 613 6 613 6 613 8 000 4 282 4 474 21.0
Goods and services 29 958 10 073 20 968 24 600 25 130 25 130 23 829 19 783 21 707 (5.2)
Administrative fees 117 – – – – – – 44 95
Advertising 666 200 165 100 100 100 100 111 67 0.0
Minor assets – – – – – – – – –
Audit cost: External – – – – – – – – –
Bursaries: Employees – – – – – – 100 – –
Catering: Departmental activities – – – – – – 50 – –
Communication (G&S) – – – – – – – 363 379
Computer services 5 886 3 387 6 340 7 400 8 400 8 400 7 000 2 607 3 153 (16.7)
Consultants and professional services: Business and advisory services – – – – – – – – –
Infrastructure and planning – – – – – – – – –
Laboratory services – – – – – – – – –
Scientific and technological services – – – – – – – – –
Legal services – – – – – – – – –
Contractors 2 619 – 1 003 1 000 1 000 1 000 500 1 003 162 (50.0)
Agency and support / outsourced services – – 56 – – – – 515 538
Entertainment – – – – – – – – –
Fleet services (including government motor transport) 584 1 350 701 1 000 1 000 1 000 1 100 844 882 10.0
Housing – – – – – – – – –
Inventory: Clothing material and accessories – – – – – – – – –
Inventory: Farming supplies – – – – – – – – –
Inventory: Food and food supplies – – – – – – – – –
Inventory: Chemicals,fuel,oil,gas,wood and coal – – – – – – – – –
Inventory: Learner and teacher support material – – – – – – – – –
Inventory: Materials and supplies – – 25 – – – – – –
Inventory: Medical supplies – – – – – – – – –
Inventory: Medicine – – – – – – – – –
Medsas inventory interface – – – – – – – – –
Inventory: Other supplies – 1 058 6 621 10 000 9 530 9 530 9 219 7 012 11 713 (3.3)
Consumable supplies – – 235 100 100 100 – – – (100.0)
Consumable: Stationery,printing and office supplies 52 – 975 900 900 900 900 1 000 313 0.0
Operating leases 17 165 3 300 2 798 3 000 3 000 3 000 3 460 5 214 2 794 15.3
Property payments – 400 416 – – – – – –
Transport provided: Departmental activity 388 – 76 – – – – – –
Travel and subsistence 1 915 378 863 400 400 400 1 000 650 1 172 150.0
Training and development 328 – 659 500 500 500 300 240 251 (40.0)
Operating payments 20 – – – – – – – –
Venues and facilities 218 – 35 200 200 200 100 180 188 (50.0)
Rental and hiring – – – – – – – – –
Interest and rent on land – – – – – – – – –
Interest – – – – – – – – –
Rent on land – – – – – – – – –
Transfers and subsidies 44 183 44 222 48 242 44 168 44 681 44 681 44 668 44 668 46 669 (0.0)
Provinces and municipalities 42 168 42 168 42 168 42 168 42 168 42 168 42 168 42 168 44 057 0.0
Provinces – – – – – – – – –
Provincial Revenue Funds – – – – – – – – –
Provincial agencies and funds – – – – – – – – –
Municipalities 42 168 42 168 42 168 42 168 42 168 42 168 42 168 42 168 44 057 0.0
Municipalities 42 168 42 168 42 168 42 168 42 168 42 168 42 168 42 168 44 057 0.0
Municipal agencies and funds – – – – – – – – –
Departmental agencies and accounts – – – – – – – – –
Social security funds – – – – – – – – –
Provide list of entities receiving transfers – – – – – – – – –
Higher education institutions – – – – – – – – –
Foreign governments and international organisations – – – – – – – – –
Public corporations and private enterprises – – – – – – – – –
Public corporations – – – – – – – – –
Subsidies on production – – – – – – – – –
Other transfers – – – – – – – – –
Private enterprises – – – – – – – – –
Subsidies on production – – – – – – – – –
Other transfers – – – – – – – – –
Non-profit institutions 2 000 2 000 2 000 2 000 2 500 2 500 2 500 2 500 2 612 0.0
Households 15 54 4 074 – 13 13 – – – (100.0)
Social benefits 15 54 4 074 – 13 13 – – – (100.0)
Other transfers to households – – – – – – – – –
Payments for capital assets 20 345 8 253 34 708 40 721 52 066 52 066 29 592 34 889 36 452 (43.2)
Buildings and other fixed structures 18 978 7 474 30 642 39 221 50 566 50 566 28 692 33 925 35 445 (43.3)
Buildings 18 978 7 474 30 642 39 221 50 566 50 566 28 692 33 925 35 445 (43.3)
Other fixed structures – – – – – – – – –
Machinery and equipment 1 367 779 4 066 1 500 1 500 1 500 900 964 1 007 (40.0)
Transport equipment 1 189 779 4 066 1 500 1 500 1 500 900 964 1 007 (40.0)
Other machinery and equipment 178 – – – – – – – –
Heritage Assets – – – – – – – – –
Specialised military assets – – – – – – – – –
Biological assets – – – – – – – – –
Land and sub-soil assets – – – – – – – – –
Software and other intangible assets – – – – – – – – –
Payments for financial assets – – – – – – – – –
Total economic classification 157 932 126 261 161 809 181 169 192 514 192 514 178 089 185 927 194 257 (7.5)
702