
Page 207 - Demo
P. 207
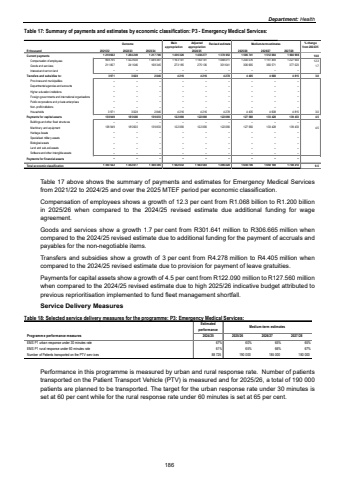
Department: HealthTable 17: Summary of payments and estimates by economic classification: P3 - Emergency Medical Services: Outcome Main appropriationAdjusted appropriation Revised estimate Medium-term estimates % change from 2024/25R thousand 2021/22 2022/23 2023/24 2025/26 2026/27 2027/28Current payments 1 264 249 1 210 602 1 217 706 1 436 326 1 438 277 1 370 052 1 506 741 1 512 064 1 604 966 10.0Compensation of employees 1 022 603 998 795 1 049 361 1 163 141 1 163 141 1 068 411 1 200 076 1 151 493 1 227 943 12.3Goods and services 241 646 211 807 168 345 273 185 275 136 301 641 306 665 360 571 377 023 1.7Interest and rent on land %u2013 %u2013 %u2013 %u2013 %u2013 %u2013 %u2013 %u2013 %u2013 Transfers and subsidies to: 3 971 3 028 2 846 4 216 4 216 4 278 4 405 4 608 4 815 3.0Provinces and municipalities %u2013 %u2013 %u2013 %u2013 %u2013 %u2013 %u2013 %u2013 %u2013Departmental agencies and accounts %u2013 %u2013 %u2013 %u2013 %u2013 %u2013 %u2013 %u2013 %u2013Higher education institutions %u2013 %u2013 %u2013 %u2013 %u2013 %u2013 %u2013 %u2013 %u2013Foreign governments and international organisations %u2013 %u2013 %u2013 %u2013 %u2013 %u2013 %u2013 %u2013 %u2013Public corporations and private enterprises %u2013 %u2013 %u2013 %u2013 %u2013 %u2013 %u2013 %u2013 %u2013Non-profit institutions %u2013 %u2013 %u2013 %u2013 %u2013 %u2013 %u2013 %u2013 %u2013Households 3 971 3 028 2 846 4 216 4 216 4 278 4 405 4 608 4 815 3.0Payments for capital assets 138 949 185 600 139 833 122 090 122 090 122 090 127 560 133 428 139 433 4.5Buildings and other fixed structures %u2013 %u2013 %u2013 %u2013 %u2013 %u2013 %u2013 %u2013 %u2013Machinery and equipment 138 949 185 600 139 833 122 090 122 090 122 090 127 560 133 428 139 433 4.5Heritage Assets %u2013 %u2013 %u2013 %u2013 %u2013 %u2013 %u2013 %u2013 %u2013Specialised military assets %u2013 %u2013 %u2013 %u2013 %u2013 %u2013 %u2013 %u2013 %u2013Biological assets %u2013 %u2013 %u2013 %u2013 %u2013 %u2013 %u2013 %u2013 %u2013Land and sub-soil assets %u2013 %u2013 %u2013 %u2013 %u2013 %u2013 %u2013 %u2013 %u2013Software and other intangible assets %u2013 %u2013 %u2013 %u2013 %u2013 %u2013 %u2013 %u2013 %u2013Payments for financial assets %u2013 %u2013 %u2013 %u2013 %u2013 %u2013 %u2013 %u2013 %u2013Total economic classification 1 353 522 1 452 877 1 360 385 1 562 632 1 564 583 1 496 420 1 638 706 1 650 100 1 749 214 9.52024/25 Table 17 above shows the summary of payments and estimates for Emergency Medical Services from 2021/22 to 2024/25 and over the 2025 MTEF period per economic classification. Compensation of employees shows a growth of 12.3 per cent from R1.068 billion to R1.200 billion in 2025/26 when compared to the 2024/25 revised estimate due additional funding for wage agreement. Goods and services show a growth 1.7 per cent from R301.641 million to R306.665 million when compared to the 2024/25 revised estimate due to additional funding for the payment of accruals and payables for the non-negotiable items. Transfers and subsidies show a growth of 3 per cent from R4.278 million to R4.405 million when compared to the 2024/25 revised estimate due to provision for payment of leave gratuities. Payments for capital assets show a growth of 4.5 per cent from R122.090 million to R127.560 million when compared to the 2024/25 revised estimate due to high 2025/26 indicative budget attributed to previous reprioritisation implemented to fund fleet management shortfall. Service Delivery Measures Table 18: Selected service delivery measures for the programme: P3: Emergency Medical Services: EstimatedperformanceMedium-term estimatesProgramme performance measures 2024/25 2025/26 2026/27 2027/28EMS P1 urban response under 30 minutes rate 67% 60% 65% 65%EMS P1 rural response under 60 minutes rate 61% 65% 66% 67%Number of Patients transported on the PTV serv ices 88 725 190 000 185 000 180 000 Performance in this programme is measured by urban and rural response rate. Number of patients transported on the Patient Transport Vehicle (PTV) is measured and for 2025/26, a total of 190 000 patients are planned to be transported. The target for the urban response rate under 30 minutes is set at 60 per cent while for the rural response rate under 60 minutes is set at 65 per cent. 186
