
Page 208 - Demo
P. 208
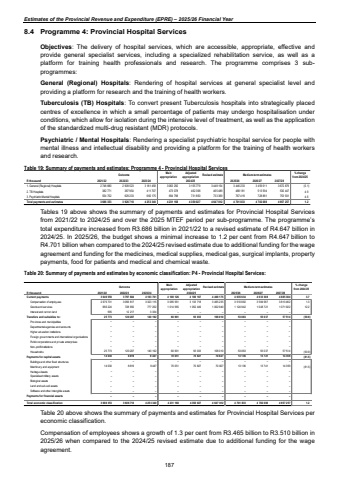
Estimates of the Provincial Revenue and Expenditure (EPRE) %u2013 2025/26 Financial Year8.4 Programme 4: Provincial Hospital Services Objectives: The delivery of hospital services, which are accessible, appropriate, effective and provide general specialist services, including a specialized rehabilitation service, as well as a platform for training health professionals and research. The programme comprises 3 subprogrammes: General (Regional) Hospitals: Rendering of hospital services at general specialist level and providing a platform for research and the training of health workers. Tuberculosis (TB) Hospitals: To convert present Tuberculosis hospitals into strategically placed centres of excellence in which a small percentage of patients may undergo hospitalisation under conditions, which allow for isolation during the intensive level of treatment, as well as the application of the standardized multi-drug resistant (MDR) protocols. Psychiatric / Mental Hospitals: Rendering a specialist psychiatric hospital service for people with mental illness and intellectual disability and providing a platform for the training of health workers and research. Table 19: Summary of payments and estimates: Programme 4 - Provincial Hospital Services Outcome Main appropriationAdjusted appropriation Revised estimate Medium-term estimates % change from 2024/25R thousand 2021/22 2022/23 2023/24 2025/26 2026/27 2027/281. General (Regional) Hospitals 2 909 523 2 748 880 3 181 458 3 063 292 3 155 779 3 448 154 3 446 233 3 459 611 3 672 879 (0.1)2. TB Hospitals 387 954 382 771 411 707 473 078 462 398 465 489 488 181 513 594 530 447 4.93. Psychiatric Mental Hospitals 629 233 554 702 660 175 694 798 731 850 733 369 767 419 728 881 753 931 4.6Total payments and estimates 3 926 710 3 686 353 4 253 340 4 231 168 4 350 027 4 647 012 4 701 833 4 702 086 4 957 257 1.22024/25Tables 19 above shows the summary of payments and estimates for Provincial Hospital Services from 2021/22 to 2024/25 and over the 2025 MTEF period per sub-programme. The programme%u2019s total expenditure increased from R3.686 billion in 2021/22 to a revised estimate of R4.647 billion in 2024/25. In 2025/26, the budget shows a minimal increase to 1.2 per cent from R4.647 billion to R4.701 billion when compared to the 2024/25 revised estimate due to additional funding for the wage agreement and funding for the medicines, medical supplies, medical gas, surgical implants, property payments, food for patients and medical and chemical waste. Table 20: Summary of payments and estimates by economic classification: P4 - Provincial Hospital Services: Outcome Main appropriationAdjusted appropriation Revised estimate Medium-term estimates % change from 2024/25R thousand 2021/22 2022/23 2023/24 2025/26 2026/27 2027/28Current payments 3 797 684 3 646 550 4 103 701 4 100 126 4 186 167 4 468 175 4 635 634 4 633 308 4 885 384 3.7Compensation of employees 2 979 731 3 056 817 3 323 115 3 085 561 3 133 718 3 465 235 3 510 692 3 584 587 3 813 462 1.3Goods and services 666 224 728 650 777 252 1 014 565 1 052 449 1 002 940 1 124 942 1 048 721 1 071 922 12.2Interest and rent on land 595 12 217 3 334 %u2013 %u2013 %u2013 %u2013 %u2013 %u2013Transfers and subsidies to: 25 773 120 207 140 192 60 991 93 033 108 010 53 063 55 037 57 514 (50.9)Provinces and municipalities %u2013 %u2013 %u2013 %u2013 %u2013 %u2013 %u2013 %u2013 %u2013Departmental agencies and accounts %u2013 %u2013 %u2013 %u2013 %u2013 %u2013 %u2013 %u2013 %u2013Higher education institutions %u2013 %u2013 %u2013 %u2013 %u2013 %u2013 %u2013 %u2013 %u2013Foreign governments and international organisations %u2013 %u2013 %u2013 %u2013 %u2013 %u2013 %u2013 %u2013 %u2013Public corporations and private enterprises %u2013 %u2013 %u2013 %u2013 %u2013 %u2013 %u2013 %u2013 %u2013Non-profit institutions %u2013 %u2013 %u2013 %u2013 %u2013 %u2013 %u2013 %u2013 %u2013Households 25 773 120 207 140 192 60 991 93 033 108 010 53 063 55 037 57 514 (50.9)Payments for capital assets 14 030 8 819 9 447 70 051 70 827 70 827 13 136 13 741 14 359 (81.5)Buildings and other fixed structures %u2013 %u2013 %u2013 %u2013 %u2013 %u2013 %u2013 %u2013 %u2013Machinery and equipment 14 030 8 819 9 447 70 051 70 827 70 827 13 136 13 741 14 359 (81.5)Heritage Assets %u2013 %u2013 %u2013 %u2013 %u2013 %u2013 %u2013 %u2013 %u2013Specialised military assets %u2013 %u2013 %u2013 %u2013 %u2013 %u2013 %u2013 %u2013 %u2013Biological assets %u2013 %u2013 %u2013 %u2013 %u2013 %u2013 %u2013 %u2013 %u2013Land and sub-soil assets %u2013 %u2013 %u2013 %u2013 %u2013 %u2013 %u2013 %u2013 %u2013Software and other intangible assets %u2013 %u2013 %u2013 %u2013 %u2013 %u2013 %u2013 %u2013 %u2013Payments for financial assets %u2013 %u2013 %u2013 %u2013 %u2013 %u2013 %u2013 %u2013 %u2013Total economic classification 3 686 353 3 926 710 4 253 340 4 231 168 4 350 027 4 647 012 4 701 833 4 702 086 4 957 257 1.22024/25Table 20 above shows the summary of payments and estimates for Provincial Hospital Services per economic classification. Compensation of employees shows a growth of 1.3 per cent from R3.465 billion to R3.510 billion in 2025/26 when compared to the 2024/25 revised estimate due to additional funding for the wage agreement. 187
