
Page 210 - Demo
P. 210
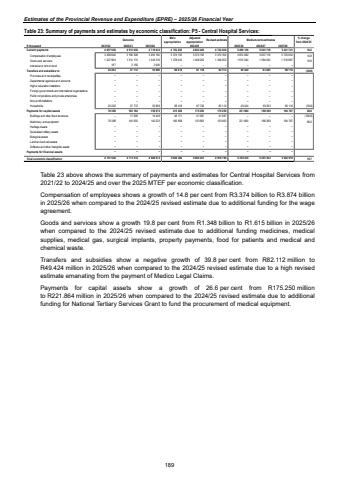
Estimates of the Provincial Revenue and Expenditure (EPRE) %u2013 2025/26 Financial YearTable 23: Summary of payments and estimates by economic classification: P5 - Central Hospital Services: Outcome Main appropriationAdjusted appropriation Revised estimate Medium-term estimates % change from 2024/25R thousand 2021/22 2022/23 2023/24 2025/26 2026/27 2027/28Current payments 4 512 638 4 657 936 4 718 032 4 752 835 4 822 445 4 722 436 5 489 126 5 041 719 5 241 741 16.2Compensation of employees 3 196 308 3 409 840 3 465 164 3 374 193 3 374 193 3 374 184 3 874 082 3 657 176 3 725 054 14.8Goods and services 1 314 174 1 247 909 1 249 219 1 378 642 1 448 252 1 348 252 1 615 044 1 384 543 1 516 687 19.8Interest and rent on land 2 156 187 3 649 %u2013 %u2013 %u2013 %u2013 %u2013 %u2013 Transfers and subsidies to: 37 772 23 202 53 869 68 418 87 736 82 112 49 424 63 263 66 110 (39.8)Provinces and municipalities %u2013 %u2013 %u2013 %u2013 %u2013 %u2013 %u2013 %u2013 %u2013Departmental agencies and accounts %u2013 %u2013 %u2013 %u2013 %u2013 %u2013 %u2013 %u2013 %u2013Higher education institutions %u2013 %u2013 %u2013 %u2013 %u2013 %u2013 %u2013 %u2013 %u2013Foreign governments and international organisations %u2013 %u2013 %u2013 %u2013 %u2013 %u2013 %u2013 %u2013 %u2013Public corporations and private enterprises %u2013 %u2013 %u2013 %u2013 %u2013 %u2013 %u2013 %u2013 %u2013Non-profit institutions %u2013 %u2013 %u2013 %u2013 %u2013 %u2013 %u2013 %u2013 %u2013Households 23 202 37 772 53 869 68 418 87 736 82 112 49 424 63 263 66 110 (39.8)Payments for capital assets 70 388 163 164 156 972 215 029 175 250 175 250 221 864 186 380 194 767 26.6Buildings and other fixed structures 17 509 %u2013 14 449 48 171 41 587 41 587 %u2013 %u2013 %u2013 (100.0)Machinery and equipment 70 388 145 655 142 523 166 858 133 663 133 663 221 864 186 380 194 767 66.0Heritage Assets %u2013 %u2013 %u2013 %u2013 %u2013 %u2013 %u2013 %u2013 %u2013Specialised military assets %u2013 %u2013 %u2013 %u2013 %u2013 %u2013 %u2013 %u2013 %u2013Biological assets %u2013 %u2013 %u2013 %u2013 %u2013 %u2013 %u2013 %u2013 %u2013Land and sub-soil assets %u2013 %u2013 %u2013 %u2013 %u2013 %u2013 %u2013 %u2013 %u2013Software and other intangible assets %u2013 %u2013 %u2013 %u2013 %u2013 %u2013 %u2013 %u2013 %u2013Payments for financial assets %u2013 %u2013 %u2013 %u2013 %u2013 %u2013 %u2013 %u2013 %u2013Total economic classification 4 751 526 4 713 574 4 928 873 5 036 282 5 085 431 4 979 798 5 760 414 5 291 362 5 502 618 15.72024/25 Table 23 above shows the summary of payments and estimates for Central Hospital Services from 2021/22 to 2024/25 and over the 2025 MTEF per economic classification. Compensation of employees shows a growth of 14.8 per cent from R3.374 billion to R3.874 billion in 2025/26 when compared to the 2024/25 revised estimate due to additional funding for the wage agreement. Goods and services show a growth 19.8 per cent from R1.348 billion to R1.615 billion in 2025/26 when compared to the 2024/25 revised estimate due to additional funding medicines, medical supplies, medical gas, surgical implants, property payments, food for patients and medical and chemical waste. Transfers and subsidies show a negative growth of 39.8 per cent from R82.112 million to R49.424 million in 2025/26 when compared to the 2024/25 revised estimate due to a high revised estimate emanating from the payment of Medico Legal Claims. Payments for capital assets show a growth of 26.6 per cent from R175.250 million to R221.864 million in 2025/26 when compared to the 2024/25 revised estimate due to additional funding for National Tertiary Services Grant to fund the procurement of medical equipment. 189
