
Page 287 - Demo
P. 287
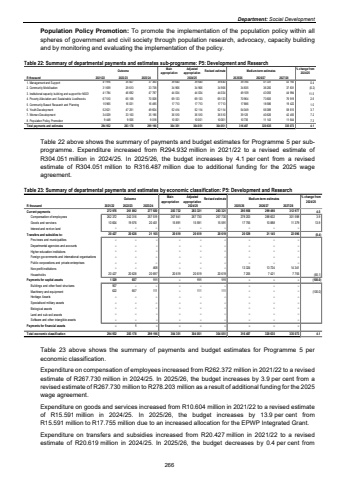
Department: Social DevelopmentPopulation Policy Promotion: To promote the implementation of the population policy within all spheres of government and civil society through population research, advocacy, capacity building and by monitoring and evaluating the implementation of the policy. Table 22: Summary of departmental payments and estimates sub-programme: P5: Development and Research Outcome Main appropriationAdjusted appropriation Revised estimate Medium-term estimates % change from 2024/25R thousand 2021/22 2022/23 2023/24 2025/26 2026/27 2027/281. Management and Support 35 827 41 916 37 350 39 640 39 640 39 640 39 784 41 331 43 193 0.42. Community Mobilisation 31 659 29 613 33 738 34 906 34 906 34 906 34 835 36 200 37 831 (0.2)3. Institutional capacity building and support for NGO's 46 692 41 784 47 787 44 034 44 034 44 034 49 109 43 055 44 994 11.54. Poverty Alleviation and Sustainable Livelihoods 67 510 65 158 70 008 69 133 69 133 69 133 70 964 73 605 76 919 2.65. Community Based Research and Planning 15 965 16 031 16 495 17 713 17 713 17 713 17 886 18 586 19 422 1.06. Youth Development 52 621 47 251 49 604 52 414 52 114 52 114 54 049 56 089 58 615 3.77. Women Development 34 029 33 100 35 196 36 510 36 510 36 510 39 125 40 626 42 455 7.28. Population Policy Promotion 9 448 9 506 9 018 10 001 10 001 10 001 10 735 11 143 11 644 7.3Total payments and estimates 294 932 283 178 299 196 304 351 304 051 304 051 316 487 320 635 335 073 4.12024/25Table 22 above shows the summary of payments and budget estimates for Programme 5 per subprogramme. Expenditure increased from R294.932 million in 2021/22 to a revised estimate of R304.051 million in 2024/25. In 2025/26, the budget increases by 4.1 per cent from a revised estimate of R304.051 million to R316.487 million due to additional funding for the 2025 wage agreement. Table 23: Summary of departmental payments and estimates by economic classification: P5: Development and Research Outcome Main appropriationAdjusted appropriation Revised estimate Medium-term estimates % change from 2024/25R thousand 2021/22 2022/23 2023/24 2025/26 2026/27 2027/28Current payments 272 976 261 892 277 920 283 732 283 321 283 321 295 958 299 490 312 977 4.5Compensation of employees 262 372 242 316 257 519 267 841 267 730 267 730 278 203 288 602 301 598 3.9Goods and services 10 604 19 576 20 401 15 891 15 591 15 591 17 755 10 888 11 379 13.9Interest and rent on land %u2013 %u2013 %u2013 %u2013 %u2013 %u2013 %u2013 %u2013 %u2013Transfers and subsidies to: 20 427 20 628 21 165 20 619 20 619 20 619 20 529 21 145 22 096 (0.4)Provinces and municipalities %u2013 %u2013 %u2013 %u2013 %u2013 %u2013 %u2013 %u2013 %u2013Departmental agencies and accounts %u2013 %u2013 %u2013 %u2013 %u2013 %u2013 %u2013 %u2013 %u2013Higher education institutions %u2013 %u2013 %u2013 %u2013 %u2013 %u2013 %u2013 %u2013 %u2013Foreign governments and international organisations %u2013 %u2013 %u2013 %u2013 %u2013 %u2013 %u2013 %u2013 %u2013Public corporations and private enterprises %u2013 %u2013 %u2013 %u2013 %u2013 %u2013 %u2013 %u2013 %u2013Non-profit institutions %u2013 %u2013 468 %u2013 %u2013 13 324 %u2013 13 724 14 341Households 20 427 20 628 20 697 20 619 20 619 20 619 7 205 7 421 7 755 (65.1)Payments for capital assets 1 529 657 111 %u2013 111 111 %u2013 %u2013 %u2013 (100.0)Buildings and other fixed structures 907 %u2013 %u2013 %u2013 %u2013 %u2013 %u2013 %u2013 %u2013Machinery and equipment 622 657 111 %u2013 111 111 %u2013 %u2013 %u2013 (100.0)Heritage Assets %u2013 %u2013 %u2013 %u2013 %u2013 %u2013 %u2013 %u2013 %u2013Specialised military assets %u2013 %u2013 %u2013 %u2013 %u2013 %u2013 %u2013 %u2013 %u2013Biological assets %u2013 %u2013 %u2013 %u2013 %u2013 %u2013 %u2013 %u2013 %u2013Land and sub-soil assets %u2013 %u2013 %u2013 %u2013 %u2013 %u2013 %u2013 %u2013 %u2013Software and other intangible assets %u2013 %u2013 %u2013 %u2013 %u2013 %u2013 %u2013 %u2013 %u2013Payments for financial assets %u2013 1 %u2013 %u2013 %u2013 %u2013 %u2013 %u2013 %u2013Total economic classification 294 932 283 178 299 196 304 351 304 051 304 051 316 487 320 635 335 073 4.12024/25Table 23 above shows the summary of payments and budget estimates for Programme 5 per economic classification. Expenditure on compensation of employees increased from R262.372 million in 2021/22 to a revised estimate of R267.730 million in 2024/25. In 2025/26, the budget increases by 3.9 per cent from a revised estimate of R267.730 million to R278.203 million as a result of additional funding for the 2025 wage agreement. Expenditure on goods and services increased from R10.604 million in 2021/22 to a revised estimate of R15.591 million in 2024/25. In 2025/26, the budget increases by 13.9 per cent from R15.591 million to R17.755 million due to an increased allocation for the EPWP Integrated Grant.Expenditure on transfers and subsidies increased from R20.427 million in 2021/22 to a revised estimate of R20.619 million in 2024/25. In 2025/26, the budget decreases by 0.4 per cent from 266
