
Page 372 - Demo
P. 372
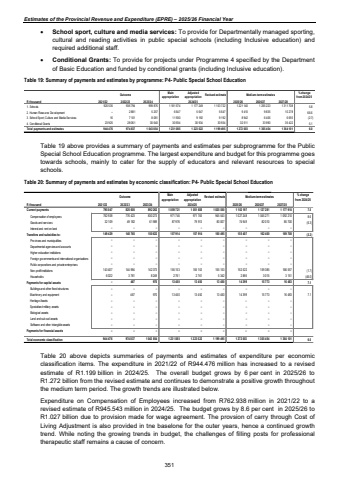
Estimates of the Provincial Revenue and Expenditure (EPRE) %u2013 2025/26 Financial Year%uf0b7 School sport, culture and media services: To provide for Departmentally managed sporting, cultural and reading activities in public special schools (including Inclusive education) and required additional staff. %uf0b7 Conditional Grants: To provide for projects under Programme 4 specified by the Department of Basic Education and funded by conditional grants (including Inclusive education). Table 19: Summary of payments and estimates by programme: P4- Public Special School EducationOutcome Main appropriationAdjusted appropriation Revised estimate Medium-term estimates % change from 2024/25R thousand 2021/22 2022/23 2023/24 2025/26 2026/27 2027/281. Schools 936 794 920 535 999 876 1 181 574 1 177 249 1 153 722 1 221 140 1 255 223 1 311 708 5.82. Human Resource Development 2 881 %u2013 5 257 6 647 5 647 5 647 9 410 9 835 10 278 66.63. School Sport, Culture and Media Services 7 101 16 8 081 11 930 9 192 9 192 8 942 6 406 6 693 (2.7)4. Conditional Grants 23 925 28 061 30 640 30 934 30 934 30 934 32 511 33 990 35 422 5.1Total payments and estimates 944 476 974 837 1 043 854 1 231 085 1 223 022 1 199 495 1 272 003 1 305 454 1 364 101 6.02024/25 Table 19 above provides a summary of payments and estimates per subprogramme for the Public Special School Education programme. The largest expenditure and budget for this programme goes towards schools, mainly to cater for the supply of educators and relevant resources to special schools.Table 20: Summary of payments and estimates by economic classification: P4- Public Special School Education Outcome Main appropriationAdjusted appropriation Revised estimate Medium-term estimates % change from 2024/25R thousand 2021/22 2022/23 2023/24 2025/26 2026/27 2027/28Current payments 795 047 825 605 892 262 1 059 721 1 051 658 1 025 550 1 102 197 1 127 281 1 177 910 7.5Compensation of employees 762 938 776 423 830 273 971 745 971 745 945 543 1 027 248 1 045 271 1 092 210 8.6Goods and services 32 109 49 182 61 989 87 976 79 913 80 007 74 949 82 010 85 700 (6.3)Interest and rent on land %u2013 %u2013 %u2013 %u2013 %u2013 %u2013 %u2013 %u2013 %u2013Transfers and subsidies to: 149 429 148 765 150 622 157 914 157 914 160 495 155 407 162 400 169 708 (3.2)Provinces and municipalities %u2013 %u2013 %u2013 %u2013 %u2013 %u2013 %u2013 %u2013 %u2013Departmental agencies and accounts %u2013 %u2013 %u2013 %u2013 %u2013 %u2013 %u2013 %u2013 %u2013Higher education institutions %u2013 %u2013 %u2013 %u2013 %u2013 %u2013 %u2013 %u2013 %u2013Foreign governments and international organisations %u2013 %u2013 %u2013 %u2013 %u2013 %u2013 %u2013 %u2013 %u2013Public corporations and private enterprises %u2013 %u2013 %u2013 %u2013 %u2013 %u2013 %u2013 %u2013 %u2013Non-profit institutions 143 407 144 984 142 373 155 153 155 153 155 153 152 522 159 385 166 557 (1.7)Households 6 022 3 781 8 249 2 761 2 761 5 342 2 885 3 015 3 151 (46.0)Payments for capital assets %u2013 467 970 13 450 13 450 13 450 14 399 15 773 16 483 7.1Buildings and other fixed structures %u2013 %u2013 %u2013 %u2013 %u2013 %u2013 %u2013 %u2013 %u2013Machinery and equipment %u2013 467 970 13 450 13 450 13 450 14 399 15 773 16 483 7.1Heritage Assets %u2013 %u2013 %u2013 %u2013 %u2013 %u2013 %u2013 %u2013 %u2013Specialised military assets %u2013 %u2013 %u2013 %u2013 %u2013 %u2013 %u2013 %u2013 %u2013Biological assets %u2013 %u2013 %u2013 %u2013 %u2013 %u2013 %u2013 %u2013 %u2013Land and sub-soil assets %u2013 %u2013 %u2013 %u2013 %u2013 %u2013 %u2013 %u2013 %u2013Software and other intangible assets %u2013 %u2013 %u2013 %u2013 %u2013 %u2013 %u2013 %u2013 %u2013Payments for financial assets %u2013 %u2013 %u2013 %u2013 %u2013 %u2013 %u2013 %u2013 %u2013Total economic classification 944 476 974 837 1 043 854 1 231 085 1 223 022 1 199 495 1 272 003 1 305 454 1 364 101 6.02024/25 Table 20 above depicts summaries of payments and estimates of expenditure per economic classification items. The expenditure in 2021/22 of R944.476 million has increased to a revised estimate of R1.199 billion in 2024/25. The overall budget grows by 6 per cent in 2025/26 to R1.272 billion from the revised estimate and continues to demonstrate a positive growth throughout the medium term period. The growth trends are illustrated below. Expenditure on Compensation of Employees increased from R762.938 million in 2021/22 to a revised estimate of R945.543 million in 2024/25. The budget grows by 8.6 per cent in 2025/26 to R1.027 billion due to provision made for wage agreement. The provsion of carry through Cost of Living Adjustment is also provided in tne baselone for the outer years, hence a continued growth trend. While noting the growing trends in budget, the challenges of filling posts for professional therapeutic staff remains a cause of concern. 351
