
Page 371 - Demo
P. 371
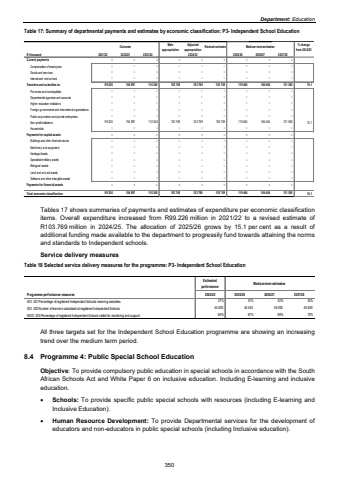
Department: EducationTable 17: Summary of departmental payments and estimates by economic classification: P3- Independent School Education Outcome Main appropriationAdjusted appropriation Revised estimate Medium-term estimates % change from 2024/25R thousand 2021/22 2022/23 2023/24 2025/26 2026/27 2027/28Current payments %u2013 %u2013 %u2013 %u2013 %u2013 %u2013 %u2013 %u2013 %u2013 Compensation of employees %u2013 %u2013 %u2013 %u2013 %u2013 %u2013 %u2013 %u2013 %u2013 Goods and services %u2013 %u2013 %u2013 %u2013 %u2013 %u2013 %u2013 %u2013 %u2013 Interest and rent on land %u2013 %u2013 %u2013 %u2013 %u2013 %u2013 %u2013 %u2013 %u2013 Transfers and subsidies to: 154 897 99 226 110 345 103 769 103 769 103 769 119 464 164 464 131 550 15.1Provinces and municipalities %u2013 %u2013 %u2013 %u2013 %u2013 %u2013 %u2013 %u2013 %u2013 Departmental agencies and accounts %u2013 %u2013 %u2013 %u2013 %u2013 %u2013 %u2013 %u2013 %u2013 Higher education institutions %u2013 %u2013 %u2013 %u2013 %u2013 %u2013 %u2013 %u2013 %u2013Foreign governments and international organisations %u2013 %u2013 %u2013 %u2013 %u2013 %u2013 %u2013 %u2013 %u2013Public corporations and private enterprises %u2013 %u2013 %u2013 %u2013 %u2013 %u2013 %u2013 %u2013 %u2013Non-profit institutions 99 226 154 897 110 345 103 769 103 769 103 769 119 464 164 464 131 550 15.1Households %u2013 %u2013 %u2013 %u2013 %u2013 %u2013 %u2013 %u2013 %u2013Payments for capital assets %u2013 %u2013 %u2013 %u2013 %u2013 %u2013 %u2013 %u2013 %u2013Buildings and other fixed structures %u2013 %u2013 %u2013 %u2013 %u2013 %u2013 %u2013 %u2013 %u2013Machinery and equipment %u2013 %u2013 %u2013 %u2013 %u2013 %u2013 %u2013 %u2013 %u2013Heritage Assets %u2013 %u2013 %u2013 %u2013 %u2013 %u2013 %u2013 %u2013 %u2013Specialised military assets %u2013 %u2013 %u2013 %u2013 %u2013 %u2013 %u2013 %u2013 %u2013Biological assets %u2013 %u2013 %u2013 %u2013 %u2013 %u2013 %u2013 %u2013 %u2013Land and sub-soil assets %u2013 %u2013 %u2013 %u2013 %u2013 %u2013 %u2013 %u2013 %u2013Software and other intangible assets %u2013 %u2013 %u2013 %u2013 %u2013 %u2013 %u2013 %u2013 %u2013Payments for financial assets %u2013 %u2013 %u2013 %u2013 %u2013 %u2013 %u2013 %u2013 %u2013Total economic classification 99 226 154 897 110 345 103 769 103 769 103 769 119 464 164 464 131 550 15.12024/25 Tables 17 shows summaries of payments and estimates of expenditure per economic classification items. Overall expenditure increased from R99.226 million in 2021/22 to a revised estimate of R103.769 million in 2024/25. The allocation of 2025/26 grows by 15.1 per cent as a result of additional funding made available to the department to progressily fund towards attaining the norms and standards to Independent schools. Service delivery measures Table 18 Selected service delivery measures for the programme: P3- Independent School Education Estimatedperformance Medium-term estimatesProgramme performance measures 2024/25 2025/26 2026/27 2027/28SOI. 301:Percentage of registered Independent Schools receiving subsidies. 37% 41% 42% 43%SOI. 302:Number of learners subsidized at registered Independent Schools. 44 453 44 500 45 000 45 500 NSOI. 303:Percentage of registered Independent Schools visited for monitoring and support. 60% 67% 69% 70% All three targets set for the Independent School Education programme are showing an increasing trend over the medium term period. 8.4 Programme 4: Public Special School Education Objective: To provide compulsory public education in special schools in accordance with the South African Schools Act and White Paper 6 on inclusive education. Including E-learning and inclusive education. %uf0b7 Schools: To provide specific public special schools with resources (including E-learning and Inclusive Education). %uf0b7 Human Resource Development: To provide Departmental services for the development of educators and non-educators in public special schools (including Inclusive education). 350
