
Page 374 - Demo
P. 374
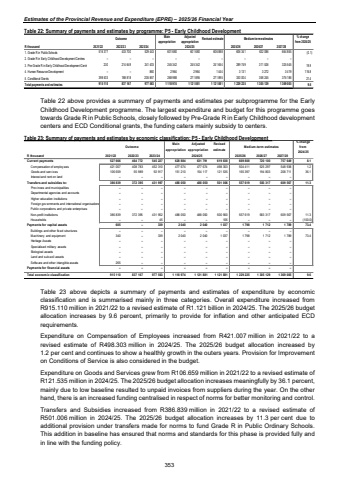
Estimates of the Provincial Revenue and Expenditure (EPRE) %u2013 2025/26 Financial YearTable 22: Summary of payments and estimates by programme: P5 - Early Childhood Development Outcome Main appropriationAdjusted appropriation Revised estimate Medium-term estimates % change from 2024/25R thousand 2021/22 2022/23 2023/24 2025/26 2026/27 2027/281. Grade R in Public Schools 516 377 433 700 529 443 601 680 601 680 606 888 606 341 632 086 664 855 (0.1)2. Grade R in Early Childhood Development Centres %u2013 %u2013 %u2013 %u2013 %u2013 %u2013 %u2013 %u2013 %u20133. Pre-Grade R in Early Childhood Development Centr 214 649 230 241 403 245 342 245 342 241 654 289 749 311 526 325 545 19.94. Human Resource Development %u2013 %u2013 860 2 964 2 964 1 444 3 131 3 272 3 419 116.85. Conditional Grants 398 503 188 818 205 857 268 988 271 895 271 895 330 004 358 245 375 186 21.4Total payments and estimates 915 110 837 167 977 563 1 118 974 1 121 881 1 121 881 1 229 225 1 305 129 1 369 005 9.62024/25 Table 22 above provides a summary of payments and estimates per subprogramme for the Early Childhood Development programme. The largest expenditure and budget for this programme goes towards Grade R in Public Schools, closely followed by Pre-Grade R in Early Childhood development centers and ECD Conditional grants, the funding caters mainly subsidy to centers.Table 23: Summary of payments and estimates by economic classification: P5 - Early Childhood Development Outcome Main appropriationAdjusted appropriationRevised estimate Medium-term estimates% changefrom 2024/25 R thousand 2021/22 2022/23 2023/24 2025/26 2026/27 2027/28Current payments 527 666 464 772 545 227 628 884 631 791 619 838 669 808 720 100 757 649 8.1Compensation of employ ees 421 007 408 783 452 310 477 674 477 674 498 303 504 411 525 297 548 938 1.2Goods and serv ices 106 659 55 989 92 917 151 210 154 117 121 535 165 397 194 803 208 711 36.1Interest and rent on land %u2013 %u2013 %u2013 %u2013 %u2013 %u2013 %u2013 %u2013 %u2013 Transfers and subsidies to: 386 839 372 395 431 997 488 050 488 050 501 006 557 619 583 317 609 567 11.3Prov inces and municipalities %u2013 %u2013 %u2013 %u2013 %u2013 %u2013 %u2013 %u2013 %u2013 Departmental agencies and accounts %u2013 %u2013 %u2013 %u2013 %u2013 %u2013 %u2013 %u2013 %u2013 Higher education institutions %u2013 %u2013 %u2013 %u2013 %u2013 %u2013 %u2013 %u2013 %u2013 Foreign gov ernments and international organisations %u2013 %u2013 %u2013 %u2013 %u2013 %u2013 %u2013 %u2013 %u2013 Public corporations and priv ate enterprises %u2013 %u2013 %u2013 %u2013 %u2013 %u2013 %u2013 %u2013 %u2013 Non-profit institutions 386 839 372 395 431 952 488 050 488 050 500 900 557 619 583 317 609 567 11.3Households %u2013 45 %u2013 %u2013 106 %u2013 %u2013 %u2013 (100.0) %u2013Payments for capital assets 605 339 %u2013 2 040 2 040 1 037 1 798 1 712 1 789 73.4Buildings and other fix ed structures %u2013 %u2013 %u2013 %u2013 %u2013 %u2013 %u2013 %u2013 %u2013 Machinery and equipment 340 339 %u2013 2 040 2 040 1 037 1 798 1 712 1 789 73.4Heritage Assets %u2013 %u2013 %u2013 %u2013 %u2013 %u2013 %u2013 %u2013 %u2013 Specialised military assets %u2013 %u2013 %u2013 %u2013 %u2013 %u2013 %u2013 %u2013 %u2013 Biological assets %u2013 %u2013 %u2013 %u2013 %u2013 %u2013 %u2013 %u2013 %u2013 Land and sub-soil assets %u2013 %u2013 %u2013 %u2013 %u2013 %u2013 %u2013 %u2013 %u2013 Softw are and other intangible assets 265 %u2013 %u2013 %u2013 %u2013 %u2013 %u2013 %u2013 %u2013 Payments for financial assets %u2013 %u2013 %u2013 %u2013 %u2013 %u2013 %u2013 %u2013 %u2013 Total economic classification 915 110 837 167 977 563 1 118 974 1 121 881 1 121 881 1 229 225 1 305 129 1 369 005 9.62024/25 Table 23 above depicts a summary of payments and estimates of expenditure by economic classification and is summarised mainly in three categories. Overall expenditure increased from R915.110 million in 2021/22 to a revised estimate of R1.121 billion in 2024/25. The 2025/26 budget allocation increases by 9.6 percent, primarily to provide for inflation and other anticipated ECD requirements. Expenditure on Compensation of Employees increased from R421.007 million in 2021/22 to a revised estimate of R498.303 million in 2024/25. The 2025/26 budget allocation increased by 1.2 per cent and continues to show a healthly growth in the outers years. Provision for Improvement on Conditions of Service is also considered in the budget. Expenditure on Goods and Services grew from R106.659 million in 2021/22 to a revised estimate of R121.535 million in 2024/25. The 2025/26 budget allocation increases meaningfully by 36.1 percent, mainly due to low baseline resulted to unpaid invoices from suppliers during the year. On the other hand, there is an increased funding centralised in respect of norms for better monitoring and control. Transfers and Subsidies increased from R386.839 million in 2021/22 to a revised estimate of R501.006 million in 2024/25. The 2025/26 budget allocation increases by 11.3 per cent due to additional provision under transfers made for norms to fund Grade R in Public Ordinary Schools. This addition in baseline has ensured that norms and standards for this phase is provided fully and in line with the funding policy. 353
