
Page 375 - Demo
P. 375
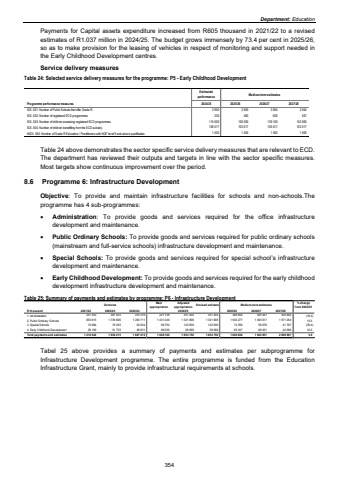
Department: EducationPayments for Capital assets expenditure increased from R605 thousand in 2021/22 to a revised estimates of R1.037 million in 2024/25. The budget grows immensely by 73.4 per cent in 2025/26, so as to make provision for the leasing of vehicles in respect of monitoring and support needed in the Early Childhood Development centres. Service delivery measures Table 24: Selected service delivery measures for the programme: P5 - Early Childhood DevelopmentEstimatedperformance Medium-term estimatesProgramme performance measures 2024/25 2025/26 2026/27 2027/28SOI. 501: Number of Public Schools that offer Grade R. 3 950 3 950 3 950 3 945SOI. 502: Number of registered ECD programmes 330 460 506 557SOI. 503: Number of children accessing registered ECD programmes 115 000 126 500 139 150 153 065SOI. 504: Number of children benefitting from the ECD subsidy. 100 517 103 017 105 517 103 017NSOI. 505: Number of Grade R Educators / Practitioners with NQF level 6 and above qualification. 1 500 1 550 1 550 1 600 Table 24 above demonstrates the sector specific service delivery measures that are relevant to ECD. The department has reviewed their outputs and targets in line with the sector specific measures. Most targets show continuous improvement over the period.8.6 Programme 6: Infrastructure Development Objective: To provide and maintain infrastructure facilities for schools and non-schools.The programme has 4 sub-programmes: %uf0b7 Administration: To provide goods and services required for the office infrastructure development and maintenance. %uf0b7 Public Ordinary Schools: To provide goods and services required for public ordinary schools (mainstream and full-service schools) infrastructure development and maintenance. %uf0b7 Special Schools: To provide goods and services required for special school%u2019s infrastructure development and maintenance. %uf0b7 Early Childhood Development: To provide goods and services required for the early childhood development infrastructure development and maintenance. Table 25: Summary of payments and estimates by programme: P6 - Infrastructure DevelopmentOutcome Main appropriationAdjusted appropriation Revised estimate Medium-term estimates % change from 2024/25R thousand 2021/22 2022/23 2023/24 2025/26 2026/27 2027/281. Administration 257 453 387 403 310 376 221 138 351 204 351 204 286 656 305 407 354 850 (18.4)2. Public Ordinary Schools 853 615 1 335 666 1 283 711 1 431 249 1 321 808 1 321 808 1 500 277 1 493 017 1 571 254 13.53. Special Schools 74 684 79 393 54 054 99 754 122 639 122 639 74 356 56 076 41 797 (39.4)4. Early Childhood Development 29 190 51 753 48 931 96 039 58 099 58 099 65 347 68 451 42 096 12.5Total payments and estimates 1 214 942 1 854 215 1 697 072 1 848 180 1 853 750 1 853 750 1 926 636 1 922 951 2 009 997 3.92024/25 Tabel 25 above provides a summary of payments and estimates per subprogramme for Infrastructure Development programme. The entire programme is funded from the Education Infrastructure Grant, mainly to provide infrastructural requirements at schools. 354
