
Page 379 - Demo
P. 379
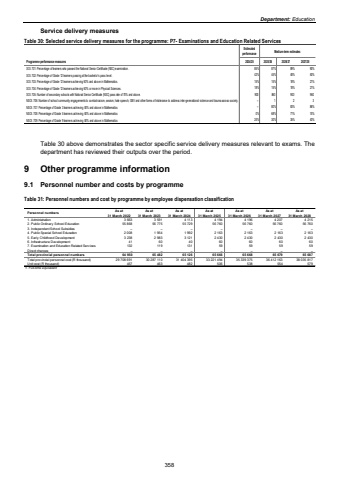
Department: EducationService delivery measures Table 30: Selected service delivery measures for the programme: P7- Examinations and Education Related Services Estimatedperformance Medium-term estimatesProgramme performance measures 2024/25 2025/26 2026/27 2027/28SOI. 701: Percentage of learners who passed the National Senior Certificate (NSC) examination. 85% 87% 89% 90%SOI. 702: Percentage of Grade 12 learners passing at the bachelor%u2019s pass level. 42% 45% 48% 50%SOI. 703: Percentage of Grade 12 learners achieving 60% and above in Mathematics. 15% 15% 18% 21%SOI. 704: Percentage of Grade 12 learners achieving 60% or more in Physical Sciences. 18% 15% 18% 21%SOI. 705: Number of secondary schools with National Senior Certificate (NSC) pass rate of 70% and above. 860 900 900 960 NSOI. 706: Number of school community engagements to combat racism, sexism, hate speech, GBV and other forms of intolerance to address inter-generational violence and trauma across society. %u2013 1 2 3NSOI. 707: Percentage of Grade 3 learners achieving 50% and above in Mathematics 80% 83% %u2013 86%NSOI. 708: Percentage of Grade 5 learners achieving 50% and above in Mathematics 0% 68% 71% 74%NSOI. 709: Percentage of Grade 9 learners achieving 50% and above in Mathematics 24% 30% 35% 40%Table 30 above demonstrates the sector specific service delivery measures relevant to exams. The department has reviewed their outputs over the period. 9 Other programme information 9.1 Personnel number and costs by programme Table 31: Personnel numbers and cost by programme by employee dispensation classification Personnel numbers As at 31 March 2022As at 31 March 2023As at 31 March 2024As at 31 March 2025As at 31 March 2026As at 31 March 2027As at 31 March 20281. Administration 3 663 3 591 4 113 4 194 4 196 4 207 4 2152. Public Ordinary School Education 55 868 56 775 55 729 56 760 56 760 56 760 56 7603. Independent School Subsidies %u2013 %u2013 %u2013 %u2013 %u2013 %u2013 %u20134. Public Special School Education 2 008 1 954 1 992 2 163 2 163 2 163 2 1635. Early Childhood Development 3 238 2 983 3 121 2 430 2 430 2 430 2 4306. Infrastructure Development 41 60 40 60 60 60 607. Examination and Education Related Services 132 119 131 59 59 59 59Direct charges %u2013 %u2013 %u2013 %u2013 %u2013 %u2013 %u2013Total provincial personnel numbers 64 950 65 482 65 126 65 666 65 668 65 679 65 687Total provincial personnel cost (R thousand) 29 708 691 30 287 110 31 404 395 33 221 494 35 339 375 36 412 163 38 035 817Unit cost (R thousand) 457 463 482 506 538 554 5791. Full-time equivalent358
