
Page 378 - Demo
P. 378
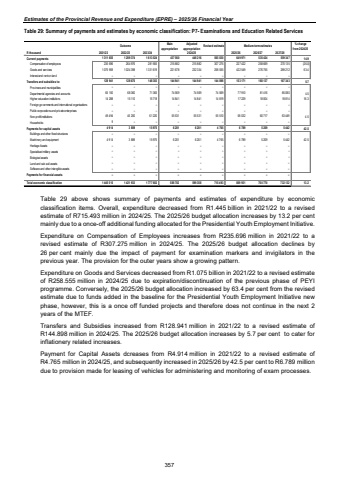
Estimates of the Provincial Revenue and Expenditure (EPRE) %u2013 2025/26 Financial YearTable 29: Summary of payments and estimates by economic classification: P7- Examinations and Education Related Services Outcome Main appropriationAdjusted appropriation Revised estimate Medium-term estimates % change from 2024/25R thousand 2021/22 2022/23 2023/24 2025/26 2026/27 2027/28Current payments 1 289 374 1 311 655 1 613 524 437 560 448 216 565 830 649 971 535 424 559 347 14.9Compensation of employees 264 976 235 696 281 905 215 882 215 882 307 275 227 422 258 669 270 135 (26.0)Goods and services 1 024 398 1 075 959 1 331 619 221 678 232 334 258 555 422 549 276 755 289 212 63.4Interest and rent on land %u2013 %u2013 %u2013 %u2013 %u2013 %u2013 %u2013 %u2013 %u2013 Transfers and subsidies to: 128 670 128 941 148 303 144 941 144 941 144 898 153 171 160 137 167 343 5.7Provinces and municipalities %u2013 %u2013 %u2013 %u2013 %u2013 %u2013 %u2013 %u2013 %u2013 Departmental agencies and accounts 68 360 65 150 71 365 74 569 74 569 74 569 77 910 81 416 85 080 4.5Higher education institutions 15 110 14 288 15 718 14 841 14 841 14 819 17 229 18 004 18 814 16.3Foreign governments and international organisations %u2013 %u2013 %u2013 %u2013 %u2013 %u2013 %u2013 %u2013 %u2013Public corporations and private enterprises %u2013 %u2013 %u2013 %u2013 %u2013 %u2013 %u2013 %u2013 %u2013Non-profit institutions 49 494 45 200 61 220 55 531 55 531 55 510 58 032 60 717 63 449 4.5Households 9 %u2013 %u2013 %u2013 %u2013 %u2013 %u2013 %u2013 %u2013Payments for capital assets 4 914 3 889 15 975 6 201 6 201 4 765 6 789 5 209 5 442 42.5Buildings and other fixed structures %u2013 %u2013 %u2013 %u2013 %u2013 %u2013 %u2013 %u2013 %u2013Machinery and equipment 4 914 3 889 15 975 6 201 6 201 4 765 6 789 5 209 5 442 42.5Heritage Assets %u2013 %u2013 %u2013 %u2013 %u2013 %u2013 %u2013 %u2013 %u2013Specialised military assets %u2013 %u2013 %u2013 %u2013 %u2013 %u2013 %u2013 %u2013 %u2013Biological assets %u2013 %u2013 %u2013 %u2013 %u2013 %u2013 %u2013 %u2013 %u2013Land and sub-soil assets %u2013 %u2013 %u2013 %u2013 %u2013 %u2013 %u2013 %u2013 %u2013Software and other intangible assets %u2013 %u2013 %u2013 %u2013 %u2013 %u2013 %u2013 %u2013 %u2013Payments for financial assets %u2013 %u2013 %u2013 %u2013 %u2013 %u2013 %u2013 %u2013 %u2013Total economic classification 1 445 510 1 421 933 1 777 802 588 702 599 358 715 493 809 931 700 770 732 132 13.22024/25 Table 29 above shows summary of payments and estimates of expenditure by economic classification items. Overall, expenditure decreased from R1.445 billion in 2021/22 to a revised estimate of R715.493 million in 2024/25. The 2025/26 budget allocation increases by 13.2 per cent mainly due to a once-off additional funding allocated for the Presidential Youth Employment Initiative. Expenditure on Compensation of Employees increases from R235.696 million in 2021/22 to a revised estimate of R307.275 million in 2024/25. The 2025/26 budget allocation declines by 26 per cent mainly due the impact of payment for examination markers and invigilators in the previous year. The provision for the outer years show a growing pattern. Expenditure on Goods and Services decreased from R1.075 billion in 2021/22 to a revised estimate of R258.555 million in 2024/25 due to expiration/discontinuation of the previous phase of PEYI programme. Conversely, the 2025/26 budget allocation increased by 63.4 per cent from the revised estimate due to funds added in the baseline for the Presidential Youth Employment Initiative new phase, however, this is a once off funded projects and therefore does not continue in the next 2 years of the MTEF. Transfers and Subsidies increased from R128.941 million in 2021/22 to a revised estimate of R144.898 million in 2024/25. The 2025/26 budget allocation increases by 5.7 per cent to cater for inflationery related increases. Payment for Capital Assets dcreases from R4.914 million in 2021/22 to a revised estimate of R4.765 million in 2024/25, and subsequently increased in 2025/26 by 42.5 per cent to R6.789 million due to provision made for leasing of vehicles for administering and monitoring of exam processes. 357
