
Page 532 - Demo
P. 532
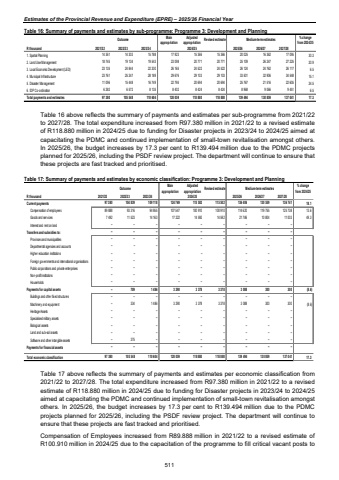
Estimates of the Provincial Revenue and Expenditure (EPRE) %u2013 2025/26 Financial YearTable 16: Summary of payments and estimates by sub-programme: Programme 3: Development and Planning Outcome Main appropriationAdjusted appropriation Revised estimate Medium-term estimates % change from 2024/25R thousand 2021/22 2022/23 2023/24 2025/26 2026/27 2027/281. Spatial Planning 14 303 14 361 15 788 17 923 15 366 15 366 20 025 16 362 17 095 30.32. Land Use Management 19 134 18 745 19 543 23 098 20 771 20 771 25 109 26 247 27 225 20.93. Local Economic Development (LED) 24 844 23 135 22 200 26 165 24 522 24 522 26 124 24 762 26 117 6.54. Municipal Infrastructure 25 247 23 761 28 189 29 676 29 103 29 103 33 501 32 906 34 548 15.15. Disaster Management 15 448 11 096 16 749 22 795 20 694 20 694 25 767 21 516 22 605 24.56. IDP Co-ordination 6 572 6 282 8 135 8 402 8 424 8 424 8 968 9 066 9 451 6.5Total payments and estimates 105 548 97 380 110 604 128 059 118 880 118 880 139 494 130 859 137 041 17.32024/25Table 16 above reflects the summary of payments and estimates per sub-programme from 2021/22 to 2027/28. The total expenditure increased from R97.380 million in 2021/22 to a revised estimate of R118.880 million in 2024/25 due to funding for Disaster projects in 2023/24 to 2024/25 aimed at capacitating the PDMC and continued implementation of small-town revitalisation amongst others. In 2025/26, the budget increases by 17.3 per cent to R139.494 million due to the PDMC projects planned for 2025/26, including the PSDF review project. The department will continue to ensure that these projects are fast tracked and prioritised. Table 17: Summary of payments and estimates by economic classification: Programme 3: Development and Planning Outcome Main appropriationAdjusted appropriation Revised estimate Medium-term estimates % change from 2024/25R thousand 2021/22 2022/23 2023/24 2025/26 2026/27 2027/28Current payments 97 380 104 839 109 118 124 769 115 502 115 502 136 406 130 559 136 741 18.1Compensation of employees 89 888 93 316 94 955 107 547 100 910 100 910 114 620 119 755 125 738 13.6Goods and services 7 492 11 523 14 163 17 222 14 592 14 592 21 786 10 804 11 003 49.3Interest and rent on land %u2013 %u2013 %u2013 %u2013 %u2013 %u2013 %u2013 %u2013 %u2013Transfers and subsidies to: %u2013 %u2013 %u2013 %u2013 %u2013 %u2013 %u2013 %u2013 %u2013Provinces and municipalities %u2013 %u2013 %u2013 %u2013 %u2013 %u2013 %u2013 %u2013 %u2013Departmental agencies and accounts %u2013 %u2013 %u2013 %u2013 %u2013 %u2013 %u2013 %u2013 %u2013Higher education institutions %u2013 %u2013 %u2013 %u2013 %u2013 %u2013 %u2013 %u2013 %u2013Foreign governments and international organisations %u2013 %u2013 %u2013 %u2013 %u2013 %u2013 %u2013 %u2013 %u2013Public corporations and private enterprises %u2013 %u2013 %u2013 %u2013 %u2013 %u2013 %u2013 %u2013 %u2013Non-profit institutions %u2013 %u2013 %u2013 %u2013 %u2013 %u2013 %u2013 %u2013 %u2013Households %u2013 %u2013 %u2013 %u2013 %u2013 %u2013 %u2013 %u2013 %u2013Payments for capital assets %u2013 709 1 486 3 290 3 378 3 378 3 088 300 300 (8.6)Buildings and other fixed structures %u2013 %u2013 %u2013 %u2013 %u2013 %u2013 %u2013 %u2013 %u2013Machinery and equipment %u2013 334 1 486 3 290 3 378 3 378 3 088 300 300 (8.6)Heritage Assets %u2013 %u2013 %u2013 %u2013 %u2013 %u2013 %u2013 %u2013 %u2013Specialised military assets %u2013 %u2013 %u2013 %u2013 %u2013 %u2013 %u2013 %u2013 %u2013Biological assets %u2013 %u2013 %u2013 %u2013 %u2013 %u2013 %u2013 %u2013 %u2013Land and sub-soil assets %u2013 %u2013 %u2013 %u2013 %u2013 %u2013 %u2013 %u2013 %u2013Software and other intangible assets %u2013 375 %u2013 %u2013 %u2013 %u2013 %u2013 %u2013 %u2013Payments for financial assets %u2013 %u2013 %u2013 %u2013 %u2013 %u2013 %u2013 %u2013 %u2013Total economic classification 97 380 105 548 110 604 128 059 118 880 118 880 139 494 130 859 137 041 17.32024/25Table 17 above reflects the summary of payments and estimates per economic classification from 2021/22 to 2027/28. The total expenditure increased from R97.380 million in 2021/22 to a revised estimate of R118.880 million in 2024/25 due to funding for Disaster projects in 2023/24 to 2024/25 aimed at capacitating the PDMC and continued implementation of small-town revitalisation amongst others. In 2025/26, the budget increases by 17.3 per cent to R139.494 million due to the PDMC projects planned for 2025/26, including the PSDF review project. The department will continue to ensure that these projects are fast tracked and prioritised. Compensation of Employees increased from R89.888 million in 2021/22 to a revised estimate of R100.910 million in 2024/25 due to the capacitation of the programme to fill critical vacant posts to 511
