
Page 593 - Demo
P. 593
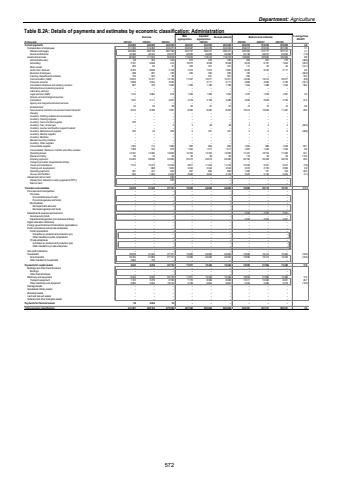
Department: AgricultureTable B.2A: Details of payments and estimates by economic classification: Administration Outcome Main appropriationAdjusted appropriation Revised estimate Medium-term estimates % change from 2024/25R thousand 2021/22 2022/23 2023/24 2025/26 2026/27 2027/28Current payments 426 025 393 902 424 525 460 621 463 655 463 655 484 876 514 639 516 800 4.6Compensation of employees 311 252 314 492 333 471 350 587 345 239 345 239 356 013 374 034 391 206 3.1Salaries and wages 265 866 268 158 282 799 293 757 288 431 288 431 300 265 315 777 327 514 4.1Social contributions 45 386 46 334 50 672 56 830 56 808 56 808 55 748 58 257 63 692 (1.9)Goods and services 82 650 111 533 90 818 110 034 118 416 118 416 128 863 140 605 125 594 8.8Administrative fees 453 98 343 273 223 393 202 297 310 (48.6)Advertising 6 848 4 187 515 10 073 8 558 8 558 6 818 8 167 7 655 (20.3)Minor assets 65 283 41 355 451 451 117 62 64 (74.1)Audit costs: External 8 638 6 452 7 128 7 973 7 973 7 803 8 339 8 724 9 117 6.9Bursaries: Employees 287 288 183 250 250 250 100 %u2013 %u2013 (60.0)Catering: Departmental activities 243 155 39 %u2013 251 251 450 %u2013 %u2013 79.3Communication (G&S) 15 727 10 812 13 129 17 437 15 271 15 271 14 049 19 212 20 077 (8.0)Computer services 5 054 5 858 3 646 %u2013 5 711 5 711 3 880 4 000 4 180 (32.1)Consultants: Business and advisory services 746 667 1 500 1 360 1 186 1 186 1 524 1 488 1 532 28.5Infrastructure and planning services %u2013 %u2013 %u2013 %u2013 %u2013 %u2013 %u2013 %u2013 %u2013Laboratory services %u2013 %u2013 %u2013 %u2013 %u2013 %u2013 %u2013 %u2013 %u2013Legal services (G&S) 2 984 1 412 919 1 405 1 405 1 424 1 470 1 538 1 581 3.2Science and technological services %u2013 %u2013 %u2013 %u2013 %u2013 %u2013 %u2013 %u2013 %u2013Contractors 2 111 1 047 2 227 3 318 3 168 3 486 4 929 2 646 2 736 41.4Agency and support/outsourced services %u2013 %u2013 %u2013 %u2013 %u2013 %u2013 %u2013 %u2013 %u2013Entertainment 26 44 38 64 67 67 73 70 72 9.0Fleet services (including government motor transport) 8 788 2 019 1 967 8 300 8 400 8 400 10 914 15 564 11 467 29.9Housing %u2013 %u2013 %u2013 %u2013 %u2013 %u2013 %u2013 %u2013 %u2013Inventory: Clothing material and accessories %u2013 %u2013 %u2013 %u2013 %u2013 %u2013 %u2013 %u2013 %u2013Inventory: Farming supplies %u2013 %u2013 %u2013 %u2013 %u2013 %u2013 %u2013 %u2013 %u2013Inventory: Food and food supplies 376 %u2013 %u2013 %u2013 %u2013 %u2013 %u2013 %u2013 %u2013Inventory: Fuel, oil and gas %u2013 %u2013 3 3 28 28 3 3 3 (89.3)Inventory: Learner and teacher support material %u2013 %u2013 %u2013 %u2013 %u2013 %u2013 %u2013 %u2013 %u2013Inventory: Materials and supplies 40 222 203 5 401 401 5 5 5 (98.8)Inventory: Medical supplies %u2013 %u2013 %u2013 %u2013 %u2013 %u2013 %u2013 %u2013 %u2013Inventory: Medicine %u2013 %u2013 %u2013 %u2013 %u2013 %u2013 %u2013 %u2013 %u2013Medsas inventory interface %u2013 %u2013 %u2013 %u2013 %u2013 %u2013 %u2013 %u2013 %u2013Inventory: Other supplies %u2013 %u2013 %u2013 %u2013 %u2013 %u2013 %u2013 %u2013 %u2013Consumable supplies 714 1 525 1 586 900 894 894 1 655 986 1 028 85.1Consumables: Stationery, printing and office supplies 722 1 399 919 1 522 1 517 1 517 1 667 1 426 1 484 9.9Operating leases 14 495 12 447 12 662 15 355 14 323 14 059 17 447 18 754 17 485 24.1Rental and hiring 12 26 34 56 56 56 119 62 64 112.5Property payments 28 046 24 935 24 960 25 273 29 619 29 282 36 762 39 558 28 378 25.5Transport provided: Departmental activity %u2013 %u2013 %u2013 %u2013 %u2013 %u2013 %u2013 %u2013 %u2013Travel and subsistence 12 473 7 514 12 244 8 817 11 224 11 418 10 545 9 427 9 237 (7.6)Training and development %u2013 688 1 825 2 254 2 544 2 544 2 619 2 739 2 862 2.9Operating payments 447 381 652 957 862 862 1 200 731 764 39.2Venues and facilities 503 1 926 4 055 4 084 4 034 4 104 3 976 5 146 5 493 (3.1)Interest and rent on land %u2013 %u2013 236 %u2013 %u2013 %u2013 %u2013 %u2013 %u2013Interest (Incl. interest on unitary payments (PPP)) %u2013 %u2013 236 %u2013 %u2013 %u2013 %u2013 %u2013 %u2013Rent on land %u2013 %u2013 %u2013 %u2013 %u2013 %u2013 %u2013 %u2013 %u2013Transfers and subsidies 30 678 21 245 27 741 15 000 24 000 24 000 19 890 20 712 19 761 (17.1)Provinces and municipalities %u2013 %u2013 %u2013 %u2013 %u2013 %u2013 %u2013 %u2013 %u2013Provinces %u2013 %u2013 %u2013 %u2013 %u2013 %u2013 %u2013 %u2013 %u2013Provincial Revenue Funds %u2013 %u2013 %u2013 %u2013 %u2013 %u2013 %u2013 %u2013 %u2013Provincial agencies and funds %u2013 %u2013 %u2013 %u2013 %u2013 %u2013 %u2013 %u2013 %u2013Municipalities %u2013 %u2013 %u2013 %u2013 %u2013 %u2013 %u2013 %u2013 %u2013Municipal bank accounts %u2013 %u2013 %u2013 %u2013 %u2013 %u2013 %u2013 %u2013 %u2013Municipal agencies and funds %u2013 %u2013 %u2013 %u2013 %u2013 %u2013 %u2013 %u2013 %u2013Departmental agencies and accounts %u2013 %u2013 %u2013 %u2013 %u2013 %u2013 4 200 4 300 4 361Social security funds %u2013 %u2013 %u2013 %u2013 %u2013 %u2013 %u2013 %u2013 %u2013Departmental agencies (non-business entities) %u2013 %u2013 %u2013 %u2013 %u2013 %u2013 4 200 4 300 4 361Higher education institutions %u2013 %u2013 %u2013 %u2013 %u2013 %u2013 %u2013 %u2013 %u2013Foreign governments and international organisations %u2013 %u2013 %u2013 %u2013 %u2013 %u2013 %u2013 %u2013 %u2013Public corporations and private enterprises %u2013 %u2013 %u2013 %u2013 %u2013 %u2013 %u2013 %u2013 %u2013Public corporations %u2013 %u2013 %u2013 %u2013 %u2013 %u2013 %u2013 %u2013 %u2013Subsidies on products and production (pc) %u2013 %u2013 %u2013 %u2013 %u2013 %u2013 %u2013 %u2013 %u2013Other transfers to public corporations %u2013 %u2013 %u2013 %u2013 %u2013 %u2013 %u2013 %u2013 %u2013Private enterprises %u2013 %u2013 %u2013 %u2013 %u2013 %u2013 %u2013 %u2013 %u2013Subsidies on products and production (pe) %u2013 %u2013 %u2013 %u2013 %u2013 %u2013 %u2013 %u2013 %u2013Other transfers to private enterprises %u2013 %u2013 %u2013 %u2013 %u2013 %u2013 %u2013 %u2013 %u2013Non-profit institutions %u2013 %u2013 %u2013 %u2013 %u2013 %u2013 %u2013 %u2013 %u2013Households 21 245 30 678 27 741 15 000 24 000 24 000 15 690 16 412 15 400 (34.6)Social benefits 21 066 26 784 27 741 15 000 24 000 24 000 15 690 16 412 15 400 (34.6)Other transfers to households 3 894 179 %u2013 %u2013 %u2013 %u2013 %u2013 %u2013 %u2013Payments for capital assets 6 942 8 230 22 776 11 971 15 429 15 429 18 055 21 866 13 480 17.0Buildings and other fixed structures %u2013 %u2013 %u2013 %u2013 %u2013 %u2013 %u2013 %u2013 %u2013Buildings %u2013 %u2013 %u2013 %u2013 %u2013 %u2013 %u2013 %u2013 %u2013Other fixed structures %u2013 %u2013 %u2013 %u2013 %u2013 %u2013 %u2013 %u2013 %u2013Machinery and equipment 6 942 8 230 22 776 11 971 15 429 15 429 18 055 21 866 13 480 17.0Transport equipment 1 122 3 276 6 760 7 172 8 586 8 586 12 511 16 480 8 201 45.7Other machinery and equipment 5 820 4 954 16 016 4 799 6 843 6 843 5 544 5 386 5 279 (19.0)Heritage Assets %u2013 %u2013 %u2013 %u2013 %u2013 %u2013 %u2013 %u2013 %u2013Specialised military assets %u2013 %u2013 %u2013 %u2013 %u2013 %u2013 %u2013 %u2013 %u2013Biological assets %u2013 %u2013 %u2013 %u2013 %u2013 %u2013 %u2013 %u2013 %u2013Land and sub-soil assets %u2013 %u2013 %u2013 %u2013 %u2013 %u2013 %u2013 %u2013 %u2013Software and other intangible assets %u2013 %u2013 %u2013 %u2013 %u2013 %u2013 %u2013 %u2013 %u2013Payments for financial assets 59 4 654 16 %u2013 %u2013 %u2013 %u2013 %u2013 %u2013Total economic classification 460 154 431 581 475 058 487 592 503 084 503 084 522 821 557 217 550 041 3.92024/25572
