
Page 594 - Demo
P. 594
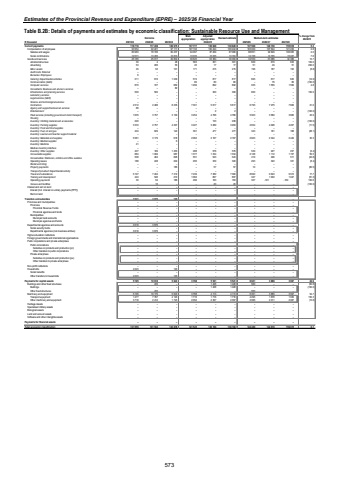
Estimates of the Provincial Revenue and Expenditure (EPRE) %u2013 2025/26 Financial YearTable B.2B: Details of payments and estimates by economic classification: Sustainable Resource Use and Management Outcome Main appropriationAdjusted appropriation Revised estimate Medium-term estimates % change from 2024/25R thousand 2021/22 2022/23 2023/24 2025/26 2026/27 2027/28Current payments 117 238 118 719 126 915 137 777 130 628 130 628 137 568 140 730 155 618 5.3Compensation of employees 93 554 92 221 97 111 107 132 100 244 100 244 103 009 107 644 121 232 2.8Salaries and wages 80 983 78 726 84 237 94 097 87 209 87 080 88 851 92 849 106 005 2.0Social contributions 12 571 13 495 12 874 13 035 13 035 13 164 14 158 14 795 15 227 7.6Goods and services 25 165 25 017 29 804 30 645 30 384 30 384 34 559 33 086 34 386 13.7Administrative fees 4 30 48 563 301 301 629 615 632 109.0Advertising 206 53 55 45 17 17 51 49 51 200.0Minor assets 45 93 101 171 215 215 196 187 193 (8.8)Audit costs: External %u2013 %u2013 %u2013 %u2013 %u2013 %u2013 %u2013 %u2013 %u2013Bursaries: Employees 6 %u2013 %u2013 %u2013 %u2013 %u2013 %u2013 %u2013 %u2013Catering: Departmental activities 619 211 1 049 574 817 817 695 617 645 (14.9)Communication (G&S) %u2013 %u2013 %u2013 80 80 80 %u2013 76 89 (100.0)Computer services 727 870 662 1 299 892 892 935 1 555 1 599 4.8Consultants: Business and advisory services %u2013 %u2013 82 %u2013 %u2013 %u2013 %u2013 %u2013 %u2013Infrastructure and planning services 500 500 %u2013 %u2013 300 300 600 %u2013 %u2013 100.0Laboratory services %u2013 %u2013 %u2013 %u2013 %u2013 %u2013 %u2013 %u2013 %u2013Legal services (G&S) %u2013 %u2013 %u2013 %u2013 %u2013 %u2013 %u2013 %u2013 %u2013Science and technological services %u2013 %u2013 %u2013 %u2013 %u2013 %u2013 %u2013 %u2013 %u2013Contractors 4 512 2 486 8 235 7 301 5 617 5 617 6 795 7 275 7 606 21.0Agency and support/outsourced services 86 %u2013 %u2013 %u2013 %u2013 %u2013 %u2013 %u2013 %u2013Entertainment %u2013 %u2013 %u2013 %u2013 2 2 %u2013 %u2013 %u2013 (100.0)Fleet services (including government motor transport) 3 757 1 635 3 100 3 254 4 766 4 766 5 903 3 560 3 660 23.9Housing %u2013 %u2013 %u2013 %u2013 %u2013 %u2013 %u2013 %u2013 %u2013Inventory: Clothing material and accessories 220 %u2013 %u2013 %u2013 133 238 %u2013 %u2013 %u2013 (100.0)Inventory: Farming supplies 2 757 3 333 4 297 3 427 3 289 3 203 2 834 4 026 4 207 (11.5)Inventory: Food and food supplies %u2013 %u2013 %u2013 %u2013 %u2013 %u2013 %u2013 %u2013 %u2013Inventory: Fuel, oil and gas 629 404 124 361 477 477 343 161 168 (28.1)Inventory: Learner and teacher support material %u2013 %u2013 %u2013 %u2013 %u2013 %u2013 %u2013 %u2013 %u2013Inventory: Materials and supplies 3 179 5 581 618 2 062 2 167 2 167 2 823 2 344 2 449 30.3Inventory: Medical supplies %u2013 %u2013 6 %u2013 %u2013 %u2013 %u2013 %u2013 %u2013Inventory: Medicine 41 %u2013 %u2013 %u2013 %u2013 %u2013 %u2013 %u2013 %u2013Medsas inventory interface %u2013 %u2013 %u2013 %u2013 %u2013 %u2013 %u2013 %u2013 %u2013Inventory: Other supplies 189 407 1 453 288 576 576 539 227 237 (6.4)Consumable supplies 1 099 884 987 1 377 1 334 1 334 2 128 1 112 1 157 59.5Consumables: Stationery, printing and office supplies 464 508 826 551 543 543 419 496 511 (22.8)Operating leases 248 188 204 295 339 320 293 322 331 (8.4)Rental and hiring %u2013 %u2013 %u2013 %u2013 %u2013 %u2013 %u2013 %u2013 %u2013Property payments %u2013 %u2013 185 %u2013 57 57 10 %u2013 %u2013 (82.5)Transport provided: Departmental activity %u2013 %u2013 %u2013 %u2013 %u2013 %u2013 %u2013 %u2013 %u2013Travel and subsistence 5 197 7 404 7 312 7 439 7 382 7 382 8 692 9 643 9 913 17.7Training and development 546 424 274 1 062 897 897 347 1 002 1 047 (61.3)Operating payments 94 30 186 496 163 163 327 -181 -109 100.6Venues and facilities %u2013 16 %u2013 %u2013 20 20 %u2013 %u2013 %u2013 (100.0)Interest and rent on land %u2013 %u2013 %u2013 %u2013 %u2013 %u2013 %u2013 %u2013 %u2013Interest (Incl. interest on unitary payments (PPP)) %u2013 %u2013 %u2013 %u2013 %u2013 %u2013 %u2013 %u2013 %u2013Rent on land %u2013 %u2013 %u2013 %u2013 %u2013 %u2013 %u2013 %u2013 %u2013Transfers and subsidies 7 641 3 676 120 %u2013 %u2013 %u2013 %u2013 %u2013 %u2013Provinces and municipalities %u2013 %u2013 %u2013 %u2013 %u2013 %u2013 %u2013 %u2013 %u2013Provinces %u2013 %u2013 %u2013 %u2013 %u2013 %u2013 %u2013 %u2013 %u2013Provincial Revenue Funds %u2013 %u2013 %u2013 %u2013 %u2013 %u2013 %u2013 %u2013 %u2013Provincial agencies and funds %u2013 %u2013 %u2013 %u2013 %u2013 %u2013 %u2013 %u2013 %u2013Municipalities %u2013 %u2013 %u2013 %u2013 %u2013 %u2013 %u2013 %u2013 %u2013Municipal bank accounts %u2013 %u2013 %u2013 %u2013 %u2013 %u2013 %u2013 %u2013 %u2013Municipal agencies and funds %u2013 %u2013 %u2013 %u2013 %u2013 %u2013 %u2013 %u2013 %u2013Departmental agencies and accounts 3 618 3 676 %u2013 %u2013 %u2013 %u2013 %u2013 %u2013 %u2013Social security funds %u2013 %u2013 %u2013 %u2013 %u2013 %u2013 %u2013 %u2013 %u2013Departmental agencies (non-business entities) 3 676 3 618 %u2013 %u2013 %u2013 %u2013 %u2013 %u2013 %u2013Higher education institutions %u2013 %u2013 %u2013 %u2013 %u2013 %u2013 %u2013 %u2013 %u2013Foreign governments and international organisations %u2013 %u2013 %u2013 %u2013 %u2013 %u2013 %u2013 %u2013 %u2013Public corporations and private enterprises %u2013 %u2013 %u2013 %u2013 %u2013 %u2013 %u2013 %u2013 %u2013Public corporations %u2013 %u2013 %u2013 %u2013 %u2013 %u2013 %u2013 %u2013 %u2013Subsidies on products and production (pc) %u2013 %u2013 %u2013 %u2013 %u2013 %u2013 %u2013 %u2013 %u2013Other transfers to public corporations %u2013 %u2013 %u2013 %u2013 %u2013 %u2013 %u2013 %u2013 %u2013Private enterprises %u2013 %u2013 %u2013 %u2013 %u2013 %u2013 %u2013 %u2013 %u2013Subsidies on products and production (pe) %u2013 %u2013 %u2013 %u2013 %u2013 %u2013 %u2013 %u2013 %u2013Other transfers to private enterprises %u2013 %u2013 %u2013 %u2013 %u2013 %u2013 %u2013 %u2013 %u2013Non-profit institutions %u2013 %u2013 %u2013 %u2013 %u2013 %u2013 %u2013 %u2013 %u2013Households 4 023 %u2013 120 %u2013 %u2013 %u2013 %u2013 %u2013 %u2013Social benefits %u2013 %u2013 %u2013 %u2013 %u2013 %u2013 %u2013 %u2013 %u2013Other transfers to households 4 023 %u2013 120 %u2013 %u2013 %u2013 %u2013 %u2013 %u2013Payments for capital assets 5 195 10 618 5 843 3 768 5 541 5 541 6 921 3 889 3 997 24.9Buildings and other fixed structures %u2013 439 %u2013 %u2013 1 428 1 428 560 %u2013 %u2013 (60.8)Buildings %u2013 %u2013 %u2013 %u2013 1 428 1 428 %u2013 %u2013 %u2013 (100.0)Other fixed structures %u2013 439 %u2013 %u2013 %u2013 %u2013 560 %u2013 %u2013Machinery and equipment 5 195 10 179 5 843 3 768 4 113 4 113 6 361 3 889 3 997 54.7Transport equipment 1 477 7 767 4 120 1 716 1 716 1 716 4 295 1 878 1 930 150.3Other machinery and equipment 3 718 2 412 1 723 2 052 2 397 2 397 2 066 2 011 2 067 (13.8)Heritage Assets %u2013 %u2013 %u2013 %u2013 %u2013 %u2013 %u2013 %u2013 %u2013Specialised military assets %u2013 %u2013 %u2013 %u2013 %u2013 %u2013 %u2013 %u2013 %u2013Biological assets %u2013 %u2013 %u2013 %u2013 %u2013 %u2013 %u2013 %u2013 %u2013Land and sub-soil assets %u2013 %u2013 %u2013 %u2013 %u2013 %u2013 %u2013 %u2013 %u2013Software and other intangible assets %u2013 %u2013 %u2013 %u2013 %u2013 %u2013 %u2013 %u2013 %u2013Payments for financial assets %u2013 %u2013 %u2013 %u2013 %u2013 %u2013 %u2013 %u2013 %u2013Total economic classification 131 532 131 555 132 878 141 545 136 169 136 169 144 489 144 619 159 615 6.12024/25573
