
Page 707 - Demo
P. 707
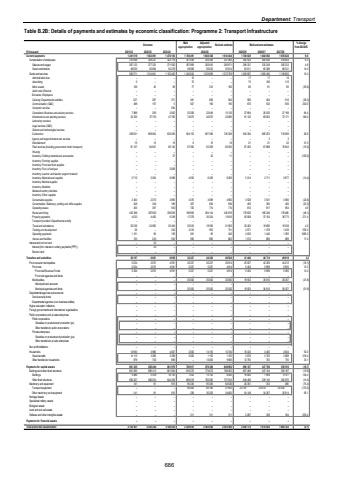
Department: Transport Table B.2B: Details of payments and estimates by economic classification: Programme 2: Transport Infrastructure Outcome Main appropriationAdjusted appropriation Revised estimate Medium-term estimates % change from 2024/25R thousand 2021/22 2022/23 2023/24 2025/26 2026/27 2027/28Current payments 1 543 091 1 241 519 1 476 183 1 700 491 1 668 308 1 614 044 1 768 629 1 484 092 1 555 626 9.6Compensation of employees 315 948 328 227 323 778 357 649 344 449 341 285 362 932 400 636 418 664 6.3Salaries and wages 267 123 277 333 271 500 297 969 293 816 285 671 299 321 335 248 350 333 4.8Social contributions 48 825 50 894 52 278 59 680 50 633 55 614 63 611 65 388 68 331 14.4Goods and services 925 571 1 214 841 1 152 405 1 342 842 1 323 859 1 272 759 1 405 697 1 083 456 1 136 962 10.4Administrative fees %u2013 %u2013 %u2013 16 %u2013 %u2013 17 17 18 Advertising %u2013 0 %u2013 72 %u2013 %u2013 75 106 110 Minor assets 45 126 58 77 210 180 80 81 85 (55.6)Audit costs: External %u2013 %u2013 %u2013 %u2013 %u2013 %u2013 %u2013 %u2013 %u2013Bursaries: Employees %u2013 %u2013 %u2013 %u2013 %u2013 %u2013 %u2013 %u2013 %u2013Catering: Departmental activities 327 297 371 481 808 940 580 494 516 (38.3)Communication (G&S) 498 157 5 507 196 190 670 532 556 252.6Computer services %u2013 %u2013 294 %u2013 %u2013 %u2013 %u2013 %u2013 %u2013Consultants: Business and advisory services 7 888 295 3 062 25 208 22 648 15 130 27 894 26 030 27 199 84.4Infrastructure and planning services 23 235 37 750 47 760 74 875 40 875 32 080 91 122 69 063 72 171 184.0Laboratory services %u2013 %u2013 %u2013 %u2013 %u2013 %u2013 %u2013 %u2013 %u2013Legal services (G&S) %u2013 %u2013 %u2013 %u2013 %u2013 %u2013 %u2013 %u2013 %u2013Science and technological services %u2013 %u2013 %u2013 %u2013 %u2013 %u2013 %u2013 %u2013 %u2013Contractors 339 921 658 824 633 028 924 153 807 396 745 528 945 394 685 253 716 089 26.8Agency and support/outsourced services %u2013 %u2013 %u2013 %u2013 %u2013 %u2013 %u2013 2 2Entertainment 15 13 19 6 16 16 21 21 22 31.3Fleet services (including government motor transport) 81 127 94 847 82 130 67 560 93 309 83 530 67 455 67 888 70 943 (19.2)Housing %u2013 %u2013 %u2013 %u2013 %u2013 %u2013 %u2013 %u2013 %u2013Inventory: Clothing material and accessories %u2013 %u2013 27 %u2013 43 11 %u2013 %u2013 %u2013 (100.0)Inventory: Farming supplies %u2013 %u2013 %u2013 %u2013 %u2013 %u2013 %u2013 %u2013 %u2013Inventory: Food and food supplies %u2013 %u2013 %u2013 %u2013 %u2013 %u2013 %u2013 %u2013 %u2013Inventory: Fuel, oil and gas %u2013 %u2013 2 828 %u2013 %u2013 %u2013 %u2013 %u2013 %u2013Inventory: Learner and teacher support material %u2013 %u2013 %u2013 %u2013 %u2013 %u2013 %u2013 %u2013 %u2013Inventory: Materials and supplies 5 710 2 264 6 088 4 505 6 429 6 209 5 314 3 711 3 877 (14.4)Inventory: Medical supplies %u2013 %u2013 %u2013 %u2013 %u2013 %u2013 %u2013 %u2013 %u2013Inventory: Medicine %u2013 %u2013 %u2013 %u2013 %u2013 %u2013 %u2013 %u2013 %u2013Medsas inventory interface %u2013 %u2013 %u2013 %u2013 %u2013 %u2013 %u2013 %u2013 %u2013Inventory: Other supplies %u2013 %u2013 %u2013 %u2013 %u2013 %u2013 %u2013 %u2013 %u2013Consumable supplies 2 463 2 070 2 885 4 376 4 589 4 560 3 528 3 531 3 690 (22.6)Consumables: Stationery, printing and office supplies 248 346 189 367 684 684 456 383 400 (33.3)Operating leases 455 387 930 720 774 774 812 817 854 4.9Rental and hiring 432 398 387 830 339 839 198 892 294 144 345 818 179 635 166 249 178 486 (48.1)Property payments 4 523 4 450 6 338 17 279 30 324 13 616 50 568 37 104 38 773 271.4Transport provided: Departmental activity %u2013 %u2013 %u2013 %u2013 %u2013 %u2013 %u2013 %u2013 %u2013Travel and subsistence 25 338 24 965 25 494 20 633 19 509 21 560 22 463 18 696 19 538 4.2Training and development 26 %u2013 334 2 318 953 731 4 571 1 378 1 439 525.3Operating payments 1 151 58 193 291 90 340 4 030 1 440 1 505 1085.3Venues and facilities 123 243 533 506 862 862 1 012 660 689 17.4Interest and rent on land %u2013 23 %u2013 %u2013 %u2013 %u2013 %u2013 %u2013 %u2013Interest (Incl. interest on unitary payments (PPP)) %u2013 23 %u2013 %u2013 %u2013 %u2013 %u2013 %u2013 %u2013Rent on land %u2013 %u2013 %u2013 %u2013 %u2013 %u2013 %u2013 %u2013 %u2013Transfers and subsidies 20 197 6 661 8 658 32 227 44 382 40 554 41 440 46 714 48 816 2.2 Provinces and municipalities 5 204 2 675 4 591 30 227 30 227 29 814 25 007 42 309 44 212 (16.1)Provinces 5 204 2 675 4 591 5 227 5 227 4 814 5 454 5 699 5 955 13.3Provincial Revenue Funds 5 204 2 675 4 591 5 227 5 227 4 814 5 454 5 699 5 955 13.3Provincial agencies and funds %u2013 %u2013 %u2013 %u2013 %u2013 %u2013 %u2013 %u2013 %u2013Municipalities %u2013 %u2013 %u2013 25 000 25 000 25 000 19 553 36 610 38 257 (21.8)Municipal bank accounts %u2013 %u2013 %u2013 %u2013 %u2013 %u2013 %u2013 %u2013 %u2013Municipal agencies and funds %u2013 %u2013 %u2013 25 000 25 000 25 000 19 553 36 610 38 257 (21.8)Departmental agencies and accounts %u2013 %u2013 %u2013 %u2013 %u2013 %u2013 %u2013 %u2013 %u2013Social security funds %u2013 %u2013 %u2013 %u2013 %u2013 %u2013 %u2013 %u2013 %u2013Departmental agencies (non-business entities) %u2013 %u2013 %u2013 %u2013 %u2013 %u2013 %u2013 %u2013 %u2013Higher education institutions %u2013 %u2013 %u2013 %u2013 %u2013 %u2013 %u2013 %u2013 %u2013Foreign governments and international organisations %u2013 %u2013 %u2013 %u2013 %u2013 %u2013 %u2013 %u2013 %u2013Public corporations and private enterprises %u2013 %u2013 %u2013 %u2013 %u2013 %u2013 %u2013 %u2013 %u2013Public corporations %u2013 %u2013 %u2013 %u2013 %u2013 %u2013 %u2013 %u2013 %u2013Subsidies on products and production (pc) %u2013 %u2013 %u2013 %u2013 %u2013 %u2013 %u2013 %u2013 %u2013Other transfers to public corporations %u2013 %u2013 %u2013 %u2013 %u2013 %u2013 %u2013 %u2013 %u2013Private enterprises %u2013 %u2013 %u2013 %u2013 %u2013 %u2013 %u2013 %u2013 %u2013Subsidies on products and production (pe) %u2013 %u2013 %u2013 %u2013 %u2013 %u2013 %u2013 %u2013 %u2013Other transfers to private enterprises %u2013 %u2013 %u2013 %u2013 %u2013 %u2013 %u2013 %u2013 %u2013Non-profit institutions %u2013 %u2013 %u2013 %u2013 %u2013 %u2013 %u2013 %u2013 %u2013Households 14 993 3 986 4 067 2 000 14 155 10 740 16 433 4 405 4 604 53.0Social benefits 14 115 3 286 3 398 2 000 1 155 1 155 3 678 3 702 3 869 218.4Other transfers to households 878 700 669 %u2013 13 000 9 585 12 755 703 735 33.1Payments for capital assets 861 235 885 494 661 979 706 917 870 366 848 992 690 107 347 796 359 910 (18.7)Buildings and other fixed structures 861 093 885 413 661 064 616 270 774 672 766 055 667 469 347 104 359 187 (12.9)Buildings 4 886 5 359 16 735 7 252 13 752 8 245 19 000 7 959 8 317 130.4Other fixed structures 856 207 880 054 644 329 609 018 760 920 757 810 648 469 339 145 350 870 (14.4)Machinery and equipment 141 81 915 90 336 95 383 82 626 20 351 353 369 (75.4)Transport equipment %u2013 %u2013 %u2013 90 000 60 180 47 943 -33 797 -34 014 -35 545 (170.5)Other machinery and equipment 141 81 915 336 35 203 34 683 54 148 34 367 35 914 56.1Heritage Assets %u2013 %u2013 %u2013 %u2013 %u2013 %u2013 %u2013 %u2013 %u2013Specialised military assets %u2013 %u2013 %u2013 %u2013 %u2013 %u2013 %u2013 %u2013 %u2013Biological assets %u2013 %u2013 %u2013 %u2013 %u2013 %u2013 %u2013 %u2013 %u2013Land and sub-soil assets %u2013 %u2013 %u2013 %u2013 %u2013 %u2013 %u2013 %u2013 %u2013Software and other intangible assets %u2013 %u2013 %u2013 311 311 311 2 287 339 354 635.4Payments for financial assets %u2013 %u2013 %u2013 %u2013 %u2013 %u2013 %u2013 %u2013 %u2013Total economic classification 2 122 951 2 435 246 2 146 820 2 439 635 2 583 056 2 503 590 2 500 176 1 878 602 1 964 352 (0.1)2024/25686
