
Page 706 - Demo
P. 706
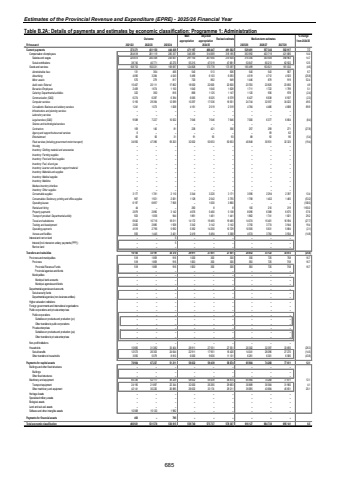
Estimates of the Provincial Revenue and Expenditure (EPRE) - 2025/26 Financial YearTable B.2A: Details of payments and estimates by economic classification: Programme 1: Administration Outcome Main appropriationAdjusted appropriation Revised estimate Medium-term estimates % change from 2024/25R thousand 2021/22 2022/23 2023/24 2025/26 2026/27 2027/28Current payments 373 371 431 150 444 439 471 197 488 447 491 582 529 491 557 340 582 917 7.7Compensation of employees 264 618 281 119 285 337 346 369 314 669 318 185 363 992 403 719 421 885 14.4Salaries and wages 225 873 240 348 243 067 291 154 267 650 270 504 310 345 343 506 358 963 14.7Social contributions 38 745 40 771 42 270 55 215 47 019 47 681 53 647 60 213 62 922 12.5Goods and services 108 753 150 031 159 097 124 828 173 778 173 397 165 499 153 621 161 032 (4.6)Administrative fees 131 364 456 540 513 506 540 543 567 6.7Advertising 4 090 3 284 4 043 5 496 6 103 6 093 4 519 4 712 4 923 (25.8)Minor assets 570 279 817 720 862 949 1 446 879 919 52.4Audit costs: External 15 407 20 111 17 802 18 500 22 600 22 600 23 700 22 825 23 850 4.9Bursaries: Employees 2 409 1 674 1 150 1 640 1 640 1 628 1 711 1 722 1 799 5.1Catering: Departmental activities 322 360 816 868 1 125 1 147 1 120 936 978 (2.4)Communication (G&S) 6 274 6 287 6 394 6 065 6 025 6 579 6 427 6 638 6 937 (2.3)Computer services 5 193 29 394 12 099 10 297 17 536 16 551 24 744 32 557 34 022 49.5Consultants: Business and advisory services 1 241 1 073 1 008 4 161 2 519 2 519 4 784 4 486 4 688 89.9Infrastructure and planning services %u2013 %u2013 %u2013 %u2013 %u2013 %u2013 %u2013 %u2013 %u2013Laboratory services %u2013 %u2013 %u2013 %u2013 %u2013 %u2013 %u2013 %u2013 %u2013Legal services (G&S) 9 588 7 227 10 002 7 646 7 646 7 646 7 000 6 377 6 664 (8.4)Science and technological services %u2013 %u2013 %u2013 %u2013 %u2013 %u2013 %u2013 %u2013 %u2013Contractors 109 140 81 238 421 356 257 259 271 (27.8)Agency and support/outsourced services 6 %u2013 %u2013 %u2013 %u2013 %u2013 %u2013 59 62Entertainment 60 56 31 91 93 93 88 92 96 (5.4)Fleet services (including government motor transport) 34 592 47 396 59 203 32 002 50 653 50 653 40 848 30 931 32 323 (19.4)Housing %u2013 %u2013 %u2013 %u2013 %u2013 %u2013 %u2013 %u2013 %u2013Inventory: Clothing material and accessories %u2013 %u2013 %u2013 %u2013 %u2013 %u2013 %u2013 %u2013 %u2013Inventory: Farming supplies %u2013 %u2013 %u2013 %u2013 %u2013 %u2013 %u2013 %u2013 %u2013Inventory: Food and food supplies %u2013 %u2013 %u2013 %u2013 %u2013 %u2013 %u2013 %u2013 %u2013Inventory: Fuel, oil and gas %u2013 %u2013 %u2013 %u2013 %u2013 %u2013 %u2013 %u2013 %u2013Inventory: Learner and teacher support material %u2013 %u2013 %u2013 %u2013 %u2013 %u2013 %u2013 %u2013 %u2013Inventory: Materials and supplies %u2013 %u2013 %u2013 %u2013 %u2013 %u2013 %u2013 %u2013 %u2013Inventory: Medical supplies %u2013 %u2013 %u2013 %u2013 %u2013 %u2013 %u2013 %u2013 %u2013Inventory: Medicine %u2013 %u2013 %u2013 %u2013 %u2013 %u2013 %u2013 %u2013 %u2013Medsas inventory interface %u2013 %u2013 %u2013 %u2013 %u2013 %u2013 %u2013 %u2013 %u2013Inventory: Other supplies %u2013 %u2013 %u2013 %u2013 %u2013 %u2013 %u2013 %u2013 %u2013Consumable supplies 3 177 1 781 2 110 3 344 3 220 3 171 3 596 2 294 2 397 13.4Consumables: Stationery, printing and office supplies 967 1 921 2 061 1 128 2 542 3 755 1 758 1 402 1 465 (53.2)Operating leases 6 197 6 897 7 906 %u2013 1 000 3 860 %u2013 %u2013 %u2013 (100.0)Rental and hiring 44 %u2013 %u2013 260 8 8 100 210 219 1150.0Property payments 2 879 2 890 3 142 4 676 5 460 5 138 8 096 6 388 6 675 57.6Transport provided: Departmental activity 923 1 056 944 1 861 1 461 1 441 1 862 1 741 1 821 29.2Travel and subsistence 6 642 10 716 18 011 14 172 19 465 19 465 14 074 15 401 16 594 (27.7)Training and development 2 820 2 885 1 928 3 342 3 142 3 142 3 750 3 774 3 944 19.4Operating payments 4 519 2 796 5 692 5 362 14 250 10 729 10 505 5 631 5 884 (2.1)Venues and facilities 593 1 445 3 401 2 419 5 494 5 368 4 574 3 764 3 934 (14.8)Interest and rent on land %u2013 %u2013 5 %u2013 %u2013 %u2013 %u2013 %u2013 %u2013Interest (Incl. interest on unitary payments (PPP)) %u2013 %u2013 5 %u2013 %u2013 %u2013 %u2013 %u2013 %u2013Rent on land %u2013 %u2013 %u2013 %u2013 %u2013 %u2013 %u2013 %u2013 %u2013Transfers and subsidies 16 183 33 191 34 370 29 911 27 851 27 851 20 652 33 122 34 613 (25.8)Provinces and municipalities 518 1 809 916 1 000 300 300 350 725 758 16.7Provinces 518 1 809 916 1 000 300 300 350 725 758 16.7Provincial Revenue Funds 518 1 809 916 1 000 300 300 350 725 758 16.7Provincial agencies and funds %u2013 %u2013 %u2013 %u2013 %u2013 %u2013 %u2013 %u2013 %u2013Municipalities %u2013 %u2013 %u2013 %u2013 %u2013 %u2013 %u2013 %u2013 %u2013Municipal bank accounts %u2013 %u2013 %u2013 %u2013 %u2013 %u2013 %u2013 %u2013 %u2013Municipal agencies and funds %u2013 %u2013 %u2013 %u2013 %u2013 %u2013 %u2013 %u2013 %u2013Departmental agencies and accounts %u2013 %u2013 %u2013 %u2013 %u2013 %u2013 %u2013 %u2013 %u2013Social security funds %u2013 %u2013 %u2013 %u2013 %u2013 %u2013 %u2013 %u2013 %u2013Departmental agencies (non-business entities) %u2013 %u2013 %u2013 %u2013 %u2013 %u2013 %u2013 %u2013 %u2013Higher education institutions %u2013 %u2013 %u2013 %u2013 %u2013 %u2013 %u2013 %u2013 %u2013Foreign governments and international organisations %u2013 %u2013 %u2013 %u2013 %u2013 %u2013 %u2013 %u2013 %u2013Public corporations and private enterprises %u2013 %u2013 %u2013 %u2013 %u2013 %u2013 %u2013 %u2013 %u2013Public corporations %u2013 %u2013 %u2013 %u2013 %u2013 %u2013 %u2013 %u2013 %u2013Subsidies on products and production (pc) %u2013 %u2013 %u2013 %u2013 %u2013 %u2013 %u2013 %u2013 %u2013Other transfers to public corporations %u2013 %u2013 %u2013 %u2013 %u2013 %u2013 %u2013 %u2013 %u2013Private enterprises %u2013 %u2013 %u2013 %u2013 %u2013 %u2013 %u2013 %u2013 %u2013Subsidies on products and production (pe) %u2013 %u2013 %u2013 %u2013 %u2013 %u2013 %u2013 %u2013 %u2013Other transfers to private enterprises %u2013 %u2013 %u2013 %u2013 %u2013 %u2013 %u2013 %u2013 %u2013Non-profit institutions %u2013 %u2013 %u2013 %u2013 %u2013 %u2013 %u2013 %u2013 %u2013Households 15 665 31 382 33 454 28 911 27 551 27 551 20 302 32 397 33 855 (26.3)Social benefits 12 573 26 303 24 644 22 911 17 951 16 420 14 041 26 096 27 270 (14.5)Other transfers to households 3 092 5 079 8 810 6 000 9 600 11 131 6 261 6 301 6 585 (43.8)Payments for capital assets 76 904 67 237 51 211 58 632 59 439 58 874 65 984 74 268 77 611 12.1Buildings and other fixed structures %u2013 %u2013 %u2013 %u2013 %u2013 %u2013 %u2013 %u2013 %u2013Buildings %u2013 %u2013 %u2013 %u2013 %u2013 %u2013 %u2013 %u2013 %u2013Other fixed structures %u2013 %u2013 %u2013 %u2013 %u2013 %u2013 %u2013 %u2013 %u2013Machinery and equipment 66 336 52 117 49 229 58 632 59 439 58 874 65 984 74 268 77 611 12.1Transport equipment 24 195 21 897 22 344 32 000 26 265 29 663 30 889 30 584 31 960 4.1Other machinery and equipment 42 141 30 220 26 885 26 632 33 174 29 211 35 095 43 684 45 651 20.1Heritage Assets %u2013 %u2013 %u2013 %u2013 %u2013 %u2013 %u2013 %u2013 %u2013Specialised military assets %u2013 %u2013 %u2013 %u2013 %u2013 %u2013 %u2013 %u2013 %u2013Biological assets %u2013 %u2013 %u2013 %u2013 %u2013 %u2013 %u2013 %u2013 %u2013Land and sub-soil assets %u2013 %u2013 %u2013 %u2013 %u2013 %u2013 %u2013 %u2013 %u2013Software and other intangible assets 10 568 15 120 1 982 %u2013 %u2013 %u2013 %u2013 %u2013 %u2013Payments for financial assets 463 %u2013 795 %u2013 %u2013 %u2013 %u2013 %u2013 %u2013Total economic classification 466 921 531 578 530 815 559 740 575 737 578 307 616 127 664 730 695 141 6.52024/25685
