
Page 705 - Demo
P. 705
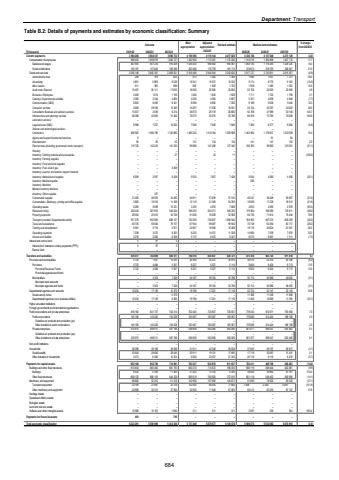
Department: Transport Table B.2: Details of payments and estimates by economic classification: Summary Outcome Main appropriationAdjusted appropriation Revised estimate Medium-term estimates % change from 2024/25R thousand 2021/22 2022/23 2023/24 2025/26 2026/27 2027/28Current payments 3 904 337 3 594 206 3 890 733 4 159 396 4 116 144 4 417 820 4 330 746 4 137 649 4 273 129 (2.0)Compensation of employees 998 053 1 058 879 1 082 727 1 242 900 1 175 201 1 175 200 1 313 019 1 394 998 1 457 772 11.7Salaries and wages 847 855 901 234 916 429 1 039 434 998 463 993 487 1 093 145 1 176 293 1 229 225 10.0Social contributions 150 197 157 645 166 298 203 466 176 738 181 713 219 874 218 705 228 547 21.0Goods and services 2 596 148 2 845 361 2 808 001 2 916 496 2 940 944 3 242 620 3 017 727 2 742 651 2 815 357 (6.9)Administrative fees 759 248 604 973 1 562 1 306 1 685 1 657 1 731 29.0Advertising 3 699 4 851 9 226 10 341 10 537 10 522 9 174 8 770 9 162 (12.8)Minor assets 385 911 888 852 1 928 1 723 1 958 1 465 1 532 13.6Audit costs: External 20 111 15 407 17 802 18 500 22 600 22 600 23 700 22 825 23 850 4.9Bursaries: Employees 2 409 1 674 1 150 1 640 1 640 1 628 1 711 1 722 1 799 5.1Catering: Departmental activities 3 090 3 244 4 684 4 026 4 584 5 667 5 231 4 639 4 848 (7.7)Communication (G&S) 6 825 6 493 6 451 8 958 6 956 7 292 8 189 9 038 9 445 12.3Computer services 5 609 29 394 12 393 10 297 17 536 16 551 24 744 32 557 34 022 49.5Consultants: Business and advisory services 15 037 2 639 6 214 36 872 28 178 20 660 50 769 47 989 50 146 145.7Infrastructure and planning services 26 388 42 050 51 462 79 575 45 575 35 789 94 818 72 783 76 058 164.9Laboratory services %u2013 %u2013 %u2013 %u2013 %u2013 %u2013 %u2013 %u2013 %u2013Legal services (G&S) 9 588 7 227 10 002 7 646 7 646 7 646 7 000 6 377 6 664 (8.4)Science and technological services %u2013 %u2013 %u2013 %u2013 %u2013 %u2013 %u2013 %u2013 %u2013Contractors 826 562 1 096 790 1 120 880 1 485 322 1 318 164 1 259 988 1 453 692 1 179 837 1 232 938 15.4Agency and support/outsourced services 6 %u2013 %u2013 %u2013 %u2013 %u2013 %u2013 61 64Entertainment 95 85 52 131 134 134 141 147 152 5.2Fleet services (including government motor transport) 115 720 142 243 141 333 99 666 147 406 137 345 108 303 98 900 103 351 (21.1)Housing %u2013 %u2013 %u2013 %u2013 %u2013 %u2013 %u2013 %u2013 %u2013Inventory: Clothing material and accessories %u2013 %u2013 27 %u2013 43 11 %u2013 %u2013 %u2013 (100.0)Inventory: Farming supplies %u2013 %u2013 %u2013 %u2013 %u2013 %u2013 %u2013 %u2013 %u2013Inventory: Food and food supplies %u2013 %u2013 %u2013 %u2013 %u2013 %u2013 %u2013 %u2013 %u2013Inventory: Fuel, oil and gas %u2013 %u2013 2 828 %u2013 %u2013 %u2013 %u2013 %u2013 %u2013Inventory: Learner and teacher support material %u2013 %u2013 %u2013 %u2013 %u2013 %u2013 %u2013 %u2013 %u2013Inventory: Materials and supplies 6 009 2 597 6 458 5 933 7 607 7 428 5 564 4 266 4 456 (25.1)Inventory: Medical supplies %u2013 %u2013 %u2013 %u2013 %u2013 %u2013 396 %u2013 %u2013Inventory: Medicine %u2013 %u2013 %u2013 %u2013 %u2013 %u2013 %u2013 %u2013 %u2013Medsas inventory interface %u2013 %u2013 %u2013 %u2013 %u2013 %u2013 %u2013 %u2013 %u2013Inventory: Other supplies %u2013 337 %u2013 %u2013 %u2013 %u2013 %u2013 %u2013 %u2013Consumable supplies 31 226 26 878 34 492 44 811 57 639 57 310 45 247 48 428 50 607 (21.0)Consumables: Stationery, printing and office supplies 3 662 10 518 11 459 12 119 21 309 24 305 19 058 17 238 18 013 (21.6)Operating leases 8 285 9 028 10 321 3 325 4 976 7 686 2 653 2 850 2 978 (65.5)Rental and hiring 432 442 387 835 340 004 199 352 294 371 346 235 179 984 166 560 178 811 (48.0)Property payments 28 594 25 910 34 709 51 636 70 038 52 969 94 736 71 814 75 044 78.9Transport provided: Departmental activity 977 379 955 065 886 107 732 292 730 827 1 080 940 764 955 847 074 829 229 (29.2)Travel and subsistence 59 730 59 036 79 757 67 944 99 087 99 944 70 748 60 494 63 717 (29.2)Training and development 6 561 5 710 5 877 22 907 16 590 16 368 19 716 20 624 21 551 20.5Operating payments 7 238 3 073 6 263 6 203 14 537 11 326 14 980 7 539 7 878 32.3Venues and facilities 2 278 2 582 6 558 5 175 9 475 9 247 8 575 6 997 7 311 (7.3)Interest and rent on land 5 97 5 %u2013 %u2013 %u2013 %u2013 %u2013 %u2013Interest (Incl. interest on unitary payments (PPP)) 5 97 5 %u2013 %u2013 %u2013 %u2013 %u2013 %u2013Rent on land %u2013 %u2013 %u2013 %u2013 %u2013 %u2013 %u2013 %u2013 %u2013Transfers and subsidies 676 517 702 869 805 517 794 516 830 457 820 721 875 418 925 725 911 418 6.7 Provinces and municipalities 5 722 7 837 12 535 40 394 45 231 38 910 36 516 52 410 54 768 (6.2)Provinces 5 722 4 484 5 507 6 227 5 527 5 114 5 804 6 424 6 713 13.5Provincial Revenue Funds 5 722 4 484 5 507 6 227 5 527 5 114 5 804 6 424 6 713 13.5Provincial agencies and funds %u2013 %u2013 %u2013 %u2013 %u2013 %u2013 %u2013 %u2013 %u2013Municipalities %u2013 3 353 7 028 34 167 39 704 33 796 30 712 45 986 48 055 (9.1)Municipal bank accounts %u2013 %u2013 %u2013 %u2013 %u2013 %u2013 %u2013 %u2013 %u2013Municipal agencies and funds %u2013 3 353 7 028 34 167 39 704 33 796 30 712 45 986 48 055 (9.1)Departmental agencies and accounts 16 234 17 129 12 370 19 786 17 221 17 116 22 724 22 147 23 143 32.8Social security funds %u2013 %u2013 5 570 %u2013 %u2013 %u2013 11 266 11 338 11 848Departmental agencies (non-business entities) 16 234 17 129 6 800 19 786 17 221 17 116 11 458 10 809 11 295 (33.1)Higher education institutions %u2013 %u2013 %u2013 %u2013 %u2013 %u2013 %u2013 %u2013 %u2013Foreign governments and international organisations %u2013 %u2013 %u2013 %u2013 %u2013 %u2013 %u2013 %u2013 %u2013Public corporations and private enterprises 616 165 641 737 742 314 702 425 725 657 725 657 778 343 812 971 793 590 7.3Public corporations 145 190 143 226 154 528 163 567 163 567 163 567 170 666 214 424 168 108 4.3Subsidies on products and production (pc) %u2013 %u2013 %u2013 %u2013 %u2013 %u2013 %u2013 %u2013 %u2013Other transfers to public corporations 145 190 143 226 154 528 163 567 163 567 163 567 170 666 214 424 168 108 4.3Private enterprises 470 975 498 511 587 786 538 858 562 090 562 090 607 677 598 547 625 482 8.1Subsidies on products and production (pe) %u2013 %u2013 %u2013 %u2013 %u2013 %u2013 %u2013 %u2013 %u2013Other transfers to private enterprises 470 975 498 511 587 786 538 858 562 090 562 090 607 677 598 547 625 482 8.1Non-profit institutions %u2013 %u2013 %u2013 %u2013 %u2013 %u2013 %u2013 %u2013 %u2013Households 38 396 36 166 38 298 31 911 42 348 39 038 37 835 38 197 39 917 (3.1)Social benefits 32 924 29 800 28 045 25 911 19 121 17 695 17 719 30 087 31 441 0.1Other transfers to households 5 473 6 366 10 253 6 000 23 227 21 343 20 116 8 110 8 476 (5.7)Payments for capital assets 952 106 952 792 714 991 783 537 932 976 911 037 783 411 468 708 486 263 (14.0)Buildings and other fixed structures 874 654 885 462 661 793 630 270 774 672 766 055 690 119 388 444 402 387 (9.9)Buildings 6 532 5 359 17 464 21 252 13 752 8 245 39 000 39 992 41 791 373.0Other fixed structures 868 122 880 103 644 329 609 018 760 920 757 810 651 119 348 452 360 596 (14.1)Machinery and equipment 66 883 52 210 51 216 152 956 157 993 144 671 91 005 79 925 83 522 (37.1)Transport equipment 24 195 21 897 23 316 122 000 86 445 77 606 -1 408 -3 430 -3 585 (101.8)Other machinery and equipment 42 688 30 313 27 900 30 956 71 548 67 065 92 413 83 355 87 107 37.8Heritage Assets %u2013 %u2013 %u2013 %u2013 %u2013 %u2013 %u2013 %u2013 %u2013Specialised military assets %u2013 %u2013 %u2013 %u2013 %u2013 %u2013 %u2013 %u2013 %u2013Biological assets %u2013 %u2013 %u2013 %u2013 %u2013 %u2013 %u2013 %u2013 %u2013Land and sub-soil assets %u2013 %u2013 %u2013 %u2013 %u2013 %u2013 %u2013 %u2013 %u2013Software and other intangible assets 10 568 15 120 1 982 311 311 311 2 287 339 354 635.4Payments for financial assets 463 %u2013 795 %u2013 %u2013 %u2013 %u2013 %u2013 %u2013Total economic classification 5 223 291 5 559 999 5 412 036 5 737 449 5 879 577 6 149 578 5 989 575 5 532 082 5 670 810 (2.6)2024/25684
