
Page 867 - Demo
P. 867
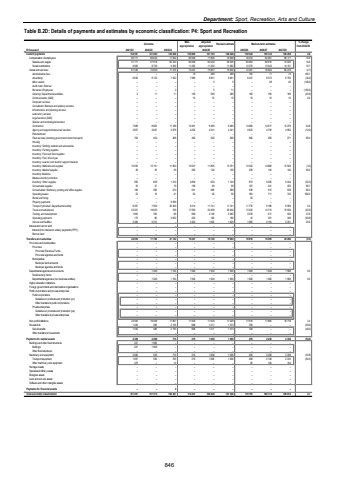
Department: Sport, Recreation, Arts and CultureTable B.2D: Details of payments and estimates by economic classification: P4: Sport and Recreation Outcome Main appropriationAdjusted appropriation Revised estimate Medium-term estimates % change from 2024/25R thousand 2021/22 2022/23 2023/24 2025/26 2026/27 2027/28Current payments 137 283 134 307 143 028 154 805 147 703 146 438 150 524 159 143 166 450 2.8Compensation of employees 66 771 66 644 71 652 80 558 71 806 70 608 78 233 82 461 86 171 10.8Salaries and wages 57 171 57 918 62 343 69 296 60 544 59 526 65 963 68 919 72 020 10.8Social contributions 9 600 8 726 9 309 11 262 11 262 11 082 12 270 13 542 14 151 10.7Goods and services 70 639 67 536 71 376 74 247 75 897 75 830 72 291 76 682 80 279 (4.7)Administrative fees %u2013 %u2013 %u2013 10 289 289 762 71 74 163.7Advertising 8 125 6 630 7 922 7 989 9 801 9 801 6 437 8 372 8 750 (34.3)Minor assets %u2013 %u2013 %u2013 %u2013 5 5 %u2013 38 40 (100.0)Audit costs: External %u2013 %u2013 %u2013 %u2013 %u2013 %u2013 %u2013 %u2013 %u2013Bursaries: Employees %u2013 %u2013 3 %u2013 5 11 %u2013 %u2013 %u2013 (100.0)Catering: Departmental activities 2 11 11 150 285 285 160 159 166 (43.9)Communication (G&S) %u2013 %u2013 %u2013 10 10 10 10 10 10 0.0Computer services %u2013 %u2013 %u2013 %u2013 %u2013 %u2013 %u2013 %u2013 %u2013Consultants: Business and advisory services %u2013 %u2013 %u2013 %u2013 %u2013 %u2013 %u2013 %u2013 %u2013Infrastructure and planning services %u2013 %u2013 %u2013 %u2013 %u2013 %u2013 %u2013 %u2013 %u2013Laboratory services %u2013 %u2013 %u2013 %u2013 %u2013 %u2013 %u2013 %u2013 %u2013Legal services (G&S) %u2013 %u2013 %u2013 %u2013 %u2013 %u2013 %u2013 %u2013 %u2013Science and technological services %u2013 %u2013 %u2013 %u2013 %u2013 %u2013 %u2013 %u2013 %u2013Contractors 7 986 8 663 11 188 10 491 9 485 9 485 14 680 14 617 15 276 54.8Agency and support/outsourced services 2 657 3 647 3 976 4 232 4 341 4 341 3 822 4 739 4 952 (12.0)Entertainment %u2013 %u2013 %u2013 %u2013 %u2013 %u2013 %u2013 %u2013 %u2013Fleet services (including government motor transport) 704 454 368 450 500 500 900 259 271 80.0Housing %u2013 %u2013 %u2013 %u2013 %u2013 %u2013 %u2013 %u2013 %u2013Inventory: Clothing material and accessories %u2013 %u2013 %u2013 %u2013 %u2013 %u2013 %u2013 %u2013 %u2013Inventory: Farming supplies %u2013 %u2013 %u2013 %u2013 %u2013 %u2013 %u2013 %u2013 %u2013Inventory: Food and food supplies %u2013 %u2013 %u2013 %u2013 %u2013 %u2013 %u2013 %u2013 %u2013Inventory: Fuel, oil and gas %u2013 %u2013 %u2013 %u2013 %u2013 %u2013 %u2013 %u2013 %u2013Inventory: Learner and teacher support material %u2013 %u2013 %u2013 %u2013 %u2013 %u2013 %u2013 %u2013 %u2013Inventory: Materials and supplies 15 033 15 151 11 854 15 637 11 895 13 791 13 342 14 880 15 549 (3.3)Inventory: Medical supplies 49 49 39 200 120 120 239 134 140 99.2Inventory: Medicine %u2013 %u2013 %u2013 %u2013 %u2013 %u2013 %u2013 %u2013 %u2013Medsas inventory interface %u2013 %u2013 %u2013 %u2013 %u2013 %u2013 %u2013 %u2013 %u2013Inventory: Other supplies 595 829 1 210 4 839 620 1 124 873 5 035 5 244 (22.3)Consumable supplies 33 47 79 156 99 99 167 241 252 68.7Consumables: Stationery, printing and office supplies 196 290 274 541 268 289 538 515 538 86.2Operating leases 23 10 41 30 30 30 180 711 742 500.0Rental and hiring %u2013 %u2013 %u2013 %u2013 %u2013 %u2013 20 %u2013 %u2013Property payments %u2013 %u2013 9 569 %u2013 %u2013 %u2013 %u2013 %u2013 %u2013Transport provided: Departmental activity 6 207 7 564 20 405 9 214 11 741 11 741 11 776 9 186 9 599 0.3Travel and subsistence 23 201 19 625 709 17 050 22 469 20 042 13 332 14 713 15 539 (33.5)Training and development 1 663 782 96 699 2 149 2 082 3 078 517 540 47.8Operating payments 175 80 3 632 220 160 160 10 331 346 (93.8)Venues and facilities 2 382 5 312 %u2013 2 329 1 625 1 625 1 965 2 154 2 251 20.9Interest and rent on land %u2013 %u2013 %u2013 %u2013 %u2013 %u2013 %u2013 %u2013 %u2013Interest (Incl. interest on unitary payments (PPP)) %u2013 %u2013 %u2013 %u2013 %u2013 %u2013 %u2013 %u2013 %u2013Rent on land %u2013 %u2013 %u2013 %u2013 %u2013 %u2013 %u2013 %u2013 %u2013Transfers and subsidies 24 835 17 794 21 722 19 227 19 740 19 902 19 816 19 395 20 286 (0.4)Provinces and municipalities %u2013 %u2013 %u2013 %u2013 %u2013 %u2013 %u2013 %u2013 %u2013Provinces %u2013 %u2013 %u2013 %u2013 %u2013 %u2013 %u2013 %u2013 %u2013Provincial Revenue Funds %u2013 %u2013 %u2013 %u2013 %u2013 %u2013 %u2013 %u2013 %u2013Provincial agencies and funds %u2013 %u2013 %u2013 %u2013 %u2013 %u2013 %u2013 %u2013 %u2013Municipalities %u2013 %u2013 %u2013 %u2013 %u2013 %u2013 %u2013 %u2013 %u2013Municipal bank accounts %u2013 %u2013 %u2013 %u2013 %u2013 %u2013 %u2013 %u2013 %u2013Municipal agencies and funds %u2013 %u2013 %u2013 %u2013 %u2013 %u2013 %u2013 %u2013 %u2013Departmental agencies and accounts %u2013 1 200 1 700 1 500 1 500 1 500 1 500 1 500 1 568 0.0Social security funds %u2013 %u2013 %u2013 %u2013 %u2013 %u2013 %u2013 %u2013 %u2013Departmental agencies (non-business entities) %u2013 1 200 1 700 1 500 1 500 1 500 1 500 1 500 1 568 0.0Higher education institutions %u2013 %u2013 %u2013 %u2013 %u2013 %u2013 %u2013 %u2013 %u2013Foreign governments and international organisations %u2013 %u2013 %u2013 %u2013 %u2013 %u2013 %u2013 %u2013 %u2013Public corporations and private enterprises %u2013 %u2013 %u2013 %u2013 %u2013 %u2013 %u2013 %u2013 %u2013Public corporations %u2013 %u2013 %u2013 %u2013 %u2013 %u2013 %u2013 %u2013 %u2013Subsidies on products and production (pc) %u2013 %u2013 %u2013 %u2013 %u2013 %u2013 %u2013 %u2013 %u2013Other transfers to public corporations %u2013 %u2013 %u2013 %u2013 %u2013 %u2013 %u2013 %u2013 %u2013Private enterprises %u2013 %u2013 %u2013 %u2013 %u2013 %u2013 %u2013 %u2013 %u2013Subsidies on products and production (pe) %u2013 %u2013 %u2013 %u2013 %u2013 %u2013 %u2013 %u2013 %u2013Other transfers to private enterprises %u2013 %u2013 %u2013 %u2013 %u2013 %u2013 %u2013 %u2013 %u2013Non-profit institutions 23 500 16 098 17 867 17 029 17 029 17 029 17 616 17 895 18 718 3.4Households 1 335 496 2 155 698 1 211 1 373 700 %u2013 %u2013 (49.0)Social benefits 1 335 496 2 155 698 1 211 1 373 700 %u2013 %u2013 (49.0)Other transfers to households %u2013 %u2013 %u2013 %u2013 %u2013 %u2013 %u2013 %u2013 %u2013Payments for capital assets 2 309 2 496 715 215 1 006 1 006 455 2 238 2 338 (54.8)Buildings and other fixed structures 227 1 966 %u2013 %u2013 %u2013 %u2013 %u2013 %u2013 %u2013Buildings 227 1 966 %u2013 %u2013 %u2013 %u2013 %u2013 %u2013 %u2013Other fixed structures %u2013 %u2013 %u2013 %u2013 %u2013 %u2013 %u2013 %u2013 %u2013Machinery and equipment 2 082 530 715 215 1 006 1 006 455 2 238 2 338 (54.8)Transport equipment 1 607 530 705 215 1 006 1 006 400 2 138 2 234 (60.2)Other machinery and equipment 475 %u2013 10 %u2013 %u2013 %u2013 55 100 104Heritage Assets %u2013 %u2013 %u2013 %u2013 %u2013 %u2013 %u2013 %u2013 %u2013Specialised military assets %u2013 %u2013 %u2013 %u2013 %u2013 %u2013 %u2013 %u2013 %u2013Biological assets %u2013 %u2013 %u2013 %u2013 %u2013 %u2013 %u2013 %u2013 %u2013Land and sub-soil assets %u2013 %u2013 %u2013 %u2013 %u2013 %u2013 %u2013 %u2013 %u2013Software and other intangible assets %u2013 %u2013 %u2013 %u2013 %u2013 %u2013 %u2013 %u2013 %u2013Payments for financial assets %u2013 %u2013 2 %u2013 %u2013 %u2013 %u2013 %u2013 %u2013Total economic classification 161 451 157 573 165 467 174 247 168 449 167 346 170 795 180 776 189 074 2.12024/25846
