
Page 870 - Demo
P. 870
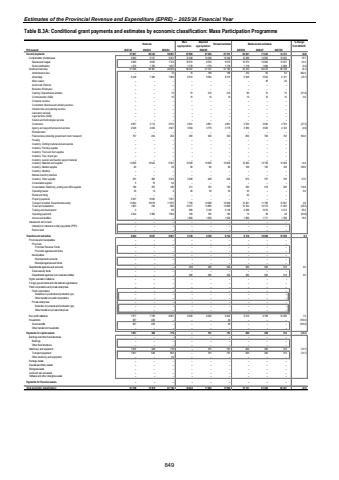
Estimates of the Provincial Revenue and Expenditure (EPRE) %u2013 2025/26 Financial YearTable B.3A: Conditional grant payments and estimates by economic classification: Mass Participation Programme Outcome Main appropriationAdjusted appropriation Revised estimate Medium-term estimates % change from 2024/25R thousand 2021/22 2022/23 2023/24 2025/26 2026/27 2027/28Current payments 62 324 57 607 58 987 67 895 67 545 67 531 65 621 71 032 74 373 (2.8)Compensation of employees 5 682 5 727 9 361 12 348 10 348 10 348 12 288 14 962 15 635 18.7Salaries and wages 4 206 4 002 7 724 10 570 8 570 8 570 10 570 12 964 13 547 23.3Social contributions 1 476 1 725 1 637 1 778 1 778 1 778 1 718 1 998 2 088 (3.4)Goods and services 56 597 51 925 49 626 55 547 57 197 57 183 53 333 56 070 58 738 (6.7)Administrative fees %u2013 %u2013 10 10 189 189 722 60 63 282.0Advertising 7 020 6 449 7 066 6 612 8 384 8 370 5 548 5 924 6 191 (33.7)Minor assets %u2013 %u2013 %u2013 %u2013 %u2013 %u2013 %u2013 38 40 Audit costs: External %u2013 %u2013 %u2013 %u2013 %u2013 %u2013 %u2013 %u2013 %u2013Bursaries: Employees %u2013 %u2013 %u2013 %u2013 %u2013 %u2013 %u2013 %u2013 %u2013Catering: Departmental activities %u2013 %u2013 72 70 210 210 80 72 75 (61.9)Communication (G&S) %u2013 %u2013 10 10 10 10 10 10 10 0.0Computer services %u2013 %u2013 %u2013 %u2013 %u2013 %u2013 %u2013 %u2013 %u2013Consultants: Business and advisory services %u2013 %u2013 %u2013 %u2013 %u2013 %u2013 %u2013 %u2013 %u2013Infrastructure and planning services %u2013 %u2013 %u2013 %u2013 %u2013 %u2013 %u2013 %u2013 %u2013Laboratory services %u2013 %u2013 %u2013 %u2013 %u2013 %u2013 %u2013 %u2013 %u2013Legal services (G&S) %u2013 %u2013 %u2013 %u2013 %u2013 %u2013 %u2013 %u2013 %u2013Science and technological services %u2013 %u2013 %u2013 %u2013 %u2013 %u2013 %u2013 %u2013 %u2013Contractors 4 607 3 114 2 512 2 841 4 861 4 861 3 534 4 500 4 703 (27.3)Agency and support/outsourced services 2 548 3 400 3 927 3 594 3 775 3 775 3 589 3 925 4 102 (4.9)Entertainment %u2013 %u2013 %u2013 %u2013 %u2013 %u2013 %u2013 %u2013 %u2013Fleet services (including government motor transport) 167 454 252 250 300 300 600 700 732 100.0Housing %u2013 %u2013 %u2013 %u2013 %u2013 %u2013 %u2013 %u2013 %u2013Inventory: Clothing material and accessories %u2013 %u2013 %u2013 %u2013 %u2013 %u2013 %u2013 %u2013 %u2013Inventory: Farming supplies %u2013 %u2013 %u2013 %u2013 %u2013 %u2013 %u2013 %u2013 %u2013Inventory: Food and food supplies %u2013 %u2013 %u2013 %u2013 %u2013 %u2013 %u2013 %u2013 %u2013Inventory: Fuel, oil and gas %u2013 %u2013 %u2013 %u2013 %u2013 %u2013 %u2013 %u2013 %u2013Inventory: Learner and teacher support material %u2013 %u2013 %u2013 %u2013 %u2013 %u2013 %u2013 %u2013 %u2013Inventory: Materials and supplies 14 626 14 522 9 381 13 929 10 909 10 909 12 484 12 728 13 299 14.4Inventory: Medical supplies 49 %u2013 39 90 80 80 199 103 108 148.8Inventory: Medicine %u2013 %u2013 %u2013 %u2013 %u2013 %u2013 %u2013 %u2013 %u2013Medsas inventory interface %u2013 %u2013 %u2013 %u2013 %u2013 %u2013 %u2013 %u2013 %u2013Inventory: Other supplies 361 829 3 534 3 269 528 528 673 707 739 27.5Consumable supplies 5 18 94 %u2013 %u2013 %u2013 %u2013 %u2013 %u2013Consumables: Stationery, printing and office supplies 180 270 380 411 183 183 393 312 326 114.8Operating leases 23 10 4 30 30 30 30 %u2013 %u2013 0.0Rental and hiring %u2013 %u2013 %u2013 %u2013 %u2013 %u2013 20 %u2013 %u2013Property payments 5 347 6 900 7 521 %u2013 %u2013 %u2013 %u2013 %u2013 %u2013Transport provided: Departmental activity 13 654 15 678 11 870 7 795 10 008 10 008 10 491 11 786 12 297 4.8Travel and subsistence 1 663 782 880 13 977 13 885 13 885 10 202 10 374 11 005 (26.5)Training and development 2 %u2013 80 699 2 149 2 149 2 928 3 074 3 212 36.2Operating payments 2 244 3 600 1 994 160 160 160 10 46 48 (93.8)Venues and facilities %u2013 %u2013 %u2013 1 800 1 536 1 536 1 820 1 711 1 788 18.5Interest and rent on land %u2013 %u2013 %u2013 %u2013 %u2013 %u2013 %u2013 %u2013 %u2013Interest (Incl. interest on unitary payments (PPP)) %u2013 %u2013 %u2013 %u2013 %u2013 %u2013 %u2013 %u2013 %u2013Rent on land %u2013 %u2013 %u2013 %u2013 %u2013 %u2013 %u2013 %u2013 %u2013Transfers and subsidies 8 044 8 027 8 081 8 729 8 729 8 743 9 316 10 068 10 540 6.6 Provinces and municipalities %u2013 %u2013 %u2013 %u2013 %u2013 %u2013 %u2013 %u2013 %u2013Provinces %u2013 %u2013 %u2013 %u2013 %u2013 %u2013 %u2013 %u2013 %u2013Provincial Revenue Funds %u2013 %u2013 %u2013 %u2013 %u2013 %u2013 %u2013 %u2013 %u2013Provincial agencies and funds %u2013 %u2013 %u2013 %u2013 %u2013 %u2013 %u2013 %u2013 %u2013Municipalities %u2013 %u2013 %u2013 %u2013 %u2013 %u2013 %u2013 %u2013 %u2013Municipal bank accounts %u2013 %u2013 %u2013 %u2013 %u2013 %u2013 %u2013 %u2013 %u2013Municipal agencies and funds %u2013 %u2013 %u2013 %u2013 %u2013 %u2013 %u2013 %u2013 %u2013Departmental agencies and accounts %u2013 %u2013 %u2013 300 300 300 300 300 314 0.0Social security funds %u2013 %u2013 %u2013 %u2013 %u2013 %u2013 %u2013 %u2013 %u2013Departmental agencies (non-business entities) %u2013 %u2013 %u2013 300 300 300 300 300 314 0.0Higher education institutions %u2013 %u2013 %u2013 %u2013 %u2013 %u2013 %u2013 %u2013 %u2013Foreign governments and international organisations %u2013 %u2013 %u2013 %u2013 %u2013 %u2013 %u2013 %u2013 %u2013Public corporations and private enterprises %u2013 %u2013 %u2013 %u2013 %u2013 %u2013 %u2013 %u2013 %u2013Public corporations %u2013 %u2013 %u2013 %u2013 %u2013 %u2013 %u2013 %u2013 %u2013Subsidies on products and production (pc) %u2013 %u2013 %u2013 %u2013 %u2013 %u2013 %u2013 %u2013 %u2013Other transfers to public corporations %u2013 %u2013 %u2013 %u2013 %u2013 %u2013 %u2013 %u2013 %u2013Private enterprises %u2013 %u2013 %u2013 %u2013 %u2013 %u2013 %u2013 %u2013 %u2013Subsidies on products and production (pe) %u2013 %u2013 %u2013 %u2013 %u2013 %u2013 %u2013 %u2013 %u2013Other transfers to private enterprises %u2013 %u2013 %u2013 %u2013 %u2013 %u2013 %u2013 %u2013 %u2013Non-profit institutions 7 677 7 798 8 081 8 429 8 429 8 423 9 016 9 768 10 226 7.0Households 367 229 %u2013 %u2013 %u2013 20 %u2013 %u2013 %u2013 (100.0)Social benefits 367 229 %u2013 %u2013 %u2013 20 %u2013 %u2013 %u2013 (100.0)Other transfers to households %u2013 %u2013 %u2013 %u2013 %u2013 %u2013 %u2013 %u2013 %u2013Payments for capital assets 1 607 528 716 %u2013 791 791 200 300 314 (74.7)Buildings and other fixed structures %u2013 %u2013 %u2013 %u2013 %u2013 %u2013 %u2013 %u2013 %u2013Buildings %u2013 %u2013 %u2013 %u2013 %u2013 %u2013 %u2013 %u2013 %u2013Other fixed structures %u2013 %u2013 %u2013 %u2013 %u2013 %u2013 %u2013 %u2013 %u2013Machinery and equipment 1 607 528 716 %u2013 791 791 200 300 314 (74.7)Transport equipment 1 607 528 663 %u2013 791 791 200 300 314 (74.7)Other machinery and equipment %u2013 %u2013 53 %u2013 %u2013 %u2013 %u2013 %u2013 %u2013Heritage Assets %u2013 %u2013 %u2013 %u2013 %u2013 %u2013 %u2013 %u2013 %u2013Specialised military assets %u2013 %u2013 %u2013 %u2013 %u2013 %u2013 %u2013 %u2013 %u2013Biological assets %u2013 %u2013 %u2013 %u2013 %u2013 %u2013 %u2013 %u2013 %u2013Land and sub-soil assets %u2013 %u2013 %u2013 %u2013 %u2013 %u2013 %u2013 %u2013 %u2013Software and other intangible assets %u2013 %u2013 %u2013 %u2013 %u2013 %u2013 %u2013 %u2013 %u2013Payments for financial assets %u2013 %u2013 %u2013 %u2013 %u2013 %u2013 %u2013 %u2013 %u2013Total economic classification 67 258 70 879 67 784 76 624 77 065 77 065 75 137 81 400 85 227 (2.5)2024/25849
