
Page 868 - Demo
P. 868
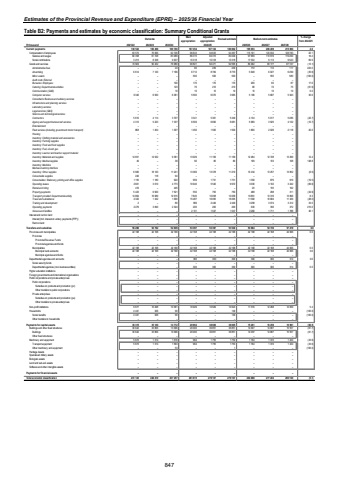
Estimates of the Provincial Revenue and Expenditure (EPRE) %u2013 2025/26 Financial YearTable B2: Payments and estimates by economic classification: Summary Conditional Grants Outcome Main appropriationAdjusted appropriation Revised estimate Medium-term estimates % change from 2024/25R thousand 2021/22 2022/23 2023/24 2025/26 2026/27 2027/28Current payments 160 498 138 522 169 706 187 454 187 104 186 962 195 653 206 209 215 890 4.6Compensation of employees 63 573 70 066 92 726 96 633 94 633 94 367 115 191 123 032 128 783 22.1Salaries and wages 60 358 61 728 83 089 86 315 84 315 84 049 97 659 113 919 119 260 16.2Social contributions 3 215 8 338 9 637 10 318 10 318 10 318 17 532 9 113 9 523 69.9Goods and services 74 949 90 432 76 980 90 821 92 471 92 595 80 462 83 177 87 107 (13.1)Administrative fees %u2013 %u2013 24 60 239 239 772 112 117 223.0Advertising 6 614 7 120 7 166 6 712 8 784 8 770 5 648 6 027 6 299 (35.6)Minor assets %u2013 %u2013 %u2013 500 500 500 %u2013 555 580 (100.0)Audit costs: External %u2013 %u2013 %u2013 %u2013 %u2013 %u2013 %u2013 %u2013 %u2013Bursaries: Employees %u2013 %u2013 100 170 170 170 200 83 87 17.6Catering: Departmental activities %u2013 %u2013 123 70 210 210 80 72 75 (61.9)Communication (G&S) %u2013 %u2013 10 10 10 10 10 10 10 0.0Computer services 6 340 6 500 6 381 5 500 6 070 3 965 5 180 5 687 5 943 30.6Consultants: Business and advisory services %u2013 %u2013 %u2013 %u2013 %u2013 %u2013 %u2013 %u2013 %u2013Infrastructure and planning services %u2013 %u2013 %u2013 %u2013 %u2013 %u2013 %u2013 %u2013 %u2013Laboratory services %u2013 %u2013 %u2013 %u2013 %u2013 %u2013 %u2013 %u2013 %u2013Legal services (G&S) %u2013 %u2013 %u2013 %u2013 %u2013 %u2013 %u2013 %u2013 %u2013Science and technological services %u2013 %u2013 %u2013 %u2013 %u2013 %u2013 %u2013 %u2013 %u2013Contractors 5 610 4 114 3 707 3 341 5 361 5 349 4 134 5 017 5 286 (22.7)Agency and support/outsourced services 4 313 5 223 7 337 6 509 6 690 6 681 5 969 3 925 4 102 (10.7)Entertainment %u2013 %u2013 %u2013 %u2013 %u2013 %u2013 %u2013 %u2013 %u2013Fleet services (including government motor transport) 868 1 454 1 307 1 450 1 500 1 500 1 800 2 026 2 118 20.0Housing %u2013 %u2013 %u2013 %u2013 %u2013 %u2013 %u2013 %u2013 %u2013Inventory: Clothing material and accessories %u2013 %u2013 %u2013 %u2013 %u2013 %u2013 %u2013 %u2013 %u2013Inventory: Farming supplies %u2013 %u2013 %u2013 %u2013 %u2013 %u2013 %u2013 %u2013 %u2013Inventory: Food and food supplies %u2013 %u2013 %u2013 %u2013 %u2013 %u2013 %u2013 %u2013 %u2013Inventory: Fuel, oil and gas %u2013 %u2013 %u2013 %u2013 %u2013 %u2013 %u2013 %u2013 %u2013Inventory: Learner and teacher support material %u2013 %u2013 %u2013 %u2013 %u2013 %u2013 %u2013 %u2013 %u2013Inventory: Materials and supplies 14 651 14 522 9 381 13 929 11 109 11 109 12 484 12 728 13 299 12.4Inventory: Medical supplies 49 %u2013 39 90 80 80 199 103 108 148.8Inventory: Medicine %u2013 %u2013 %u2013 %u2013 %u2013 %u2013 %u2013 %u2013 %u2013Medsas inventory interface %u2013 %u2013 %u2013 %u2013 %u2013 %u2013 %u2013 %u2013 %u2013Inventory: Other supplies 6 982 18 120 11 241 13 369 13 378 11 210 10 434 13 257 13 852 (6.9)Consumable supplies 240 118 94 %u2013 %u2013 %u2013 %u2013 %u2013 %u2013Consumables: Stationery, printing and office supplies 1 155 1 180 922 959 1 731 1 731 1 393 879 919 (19.5)Operating leases 2 821 3 010 4 773 10 940 5 540 9 972 3 030 3 102 3 242 (69.6)Rental and hiring 416 %u2013 445 %u2013 %u2013 %u2013 20 155 162Property payments 5 423 6 900 7 521 550 750 750 488 298 311 (34.9)Transport provided: Departmental activity 14 864 16 989 12 915 7 845 10 058 10 058 10 891 13 316 13 896 8.3Travel and subsistence 2 322 1 342 1 090 15 487 16 095 16 095 11 582 10 684 11 329 (28.0)Training and development 2 %u2013 80 999 2 449 2 449 3 258 3 074 3 212 33.0Operating payments 2 279 3 840 2 324 200 200 200 630 356 372 215.0Venues and facilities %u2013 %u2013 %u2013 2 131 1 547 1 547 2 260 1 711 1 788 46.1Interest and rent on land %u2013 %u2013 %u2013 %u2013 %u2013 %u2013 %u2013 %u2013 %u2013Interest (Incl. interest on unitary payments (PPP)) %u2013 %u2013 %u2013 %u2013 %u2013 %u2013 %u2013 %u2013 %u2013Rent on land %u2013 %u2013 %u2013 %u2013 %u2013 %u2013 %u2013 %u2013 %u2013Transfers and subsidies 56 286 52 792 52 839 53 397 53 397 53 540 53 984 54 736 57 219 0.8 Provinces and municipalities 42 168 42 168 42 168 42 168 42 168 42 168 42 168 42 168 44 066 0.0Provinces %u2013 %u2013 %u2013 %u2013 %u2013 %u2013 %u2013 %u2013 %u2013Provincial Revenue Funds %u2013 %u2013 %u2013 %u2013 %u2013 %u2013 %u2013 %u2013 %u2013Provincial agencies and funds %u2013 %u2013 %u2013 %u2013 %u2013 %u2013 %u2013 %u2013 %u2013Municipalities 42 168 42 168 42 168 42 168 42 168 42 168 42 168 42 168 44 066 0.0Municipal bank accounts 42 168 42 168 42 168 42 168 42 168 42 168 42 168 42 168 44 066 0.0Municipal agencies and funds %u2013 %u2013 %u2013 %u2013 %u2013 %u2013 %u2013 %u2013 %u2013Departmental agencies and accounts %u2013 %u2013 %u2013 300 300 300 300 300 314 0.0Social security funds %u2013 %u2013 %u2013 %u2013 %u2013 %u2013 %u2013 %u2013 %u2013Departmental agencies (non-business entities) %u2013 %u2013 %u2013 300 300 300 300 300 314 0.0Higher education institutions %u2013 %u2013 %u2013 %u2013 %u2013 %u2013 %u2013 %u2013 %u2013Foreign governments and international organisations %u2013 %u2013 %u2013 %u2013 %u2013 %u2013 %u2013 %u2013 %u2013Public corporations and private enterprises %u2013 %u2013 %u2013 %u2013 %u2013 %u2013 %u2013 %u2013 %u2013Public corporations %u2013 %u2013 %u2013 %u2013 %u2013 %u2013 %u2013 %u2013 %u2013Subsidies on products and production (pc) %u2013 %u2013 %u2013 %u2013 %u2013 %u2013 %u2013 %u2013 %u2013Other transfers to public corporations %u2013 %u2013 %u2013 %u2013 %u2013 %u2013 %u2013 %u2013 %u2013Private enterprises %u2013 %u2013 %u2013 %u2013 %u2013 %u2013 %u2013 %u2013 %u2013Subsidies on products and production (pe) %u2013 %u2013 %u2013 %u2013 %u2013 %u2013 %u2013 %u2013 %u2013Other transfers to private enterprises %u2013 %u2013 %u2013 %u2013 %u2013 %u2013 %u2013 %u2013 %u2013Non-profit institutions 9 677 10 298 10 581 10 929 10 929 10 923 11 516 12 268 12 839 5.4Households 4 441 326 90 %u2013 %u2013 149 %u2013 %u2013 %u2013 (100.0)Social benefits 4 441 326 90 %u2013 %u2013 149 %u2013 %u2013 %u2013 (100.0)Other transfers to households %u2013 %u2013 %u2013 %u2013 %u2013 %u2013 %u2013 %u2013 %u2013Payments for capital assets 36 315 35 120 14 712 20 964 38 606 38 605 15 261 16 259 16 991 (60.5)Buildings and other fixed structures 30 642 33 806 13 096 20 000 36 851 36 851 14 097 14 887 15 557 (61.7)Buildings 30 642 33 806 13 096 20 000 36 851 36 851 14 097 14 887 15 557 (61.7)Other fixed structures %u2013 %u2013 %u2013 %u2013 %u2013 %u2013 %u2013 %u2013 %u2013Machinery and equipment 5 673 1 314 1 616 964 1 755 1 754 1 164 1 372 1 434 (33.6)Transport equipment 5 673 1 314 1 563 964 1 755 1 753 1 164 1 372 1 434 (33.6)Other machinery and equipment %u2013 %u2013 53 %u2013 %u2013 1 %u2013 %u2013 %u2013 (100.0)Heritage Assets %u2013 %u2013 %u2013 %u2013 %u2013 %u2013 %u2013 %u2013 %u2013Specialised military assets %u2013 %u2013 %u2013 %u2013 %u2013 %u2013 %u2013 %u2013 %u2013Biological assets %u2013 %u2013 %u2013 %u2013 %u2013 %u2013 %u2013 %u2013 %u2013Land and sub-soil assets %u2013 %u2013 %u2013 %u2013 %u2013 %u2013 %u2013 %u2013 %u2013Software and other intangible assets %u2013 %u2013 %u2013 %u2013 %u2013 %u2013 %u2013 %u2013 %u2013Payments for financial assets %u2013 %u2013 %u2013 %u2013 %u2013 %u2013 %u2013 %u2013 %u2013Total economic classification 231 123 248 410 237 257 261 815 279 107 279 107 264 898 277 204 290 100 (5.1)2024/25847
