
Page 869 - Demo
P. 869
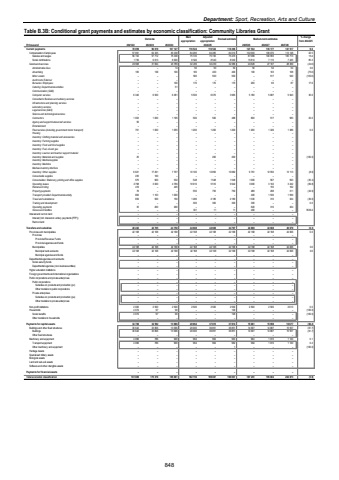
Department: Sport, Recreation, Arts and CultureTable B.3B: Conditional grant payments and estimates by economic classification: Community Libraries Grant Outcome Main appropriationAdjusted appropriation Revised estimate Medium-term estimates % change from 2024/25R thousand 2021/22 2022/23 2023/24 2025/26 2026/27 2027/28Current payments 78 859 96 019 107 127 116 524 116 524 116 396 127 532 135 177 141 517 9.6Compensation of employees 57 891 64 325 83 338 84 285 84 285 84 010 102 903 108 070 113 148 22.5Salaries and wages 56 152 57 712 75 338 75 745 75 745 75 470 87 089 100 955 105 713 15.4Social contributions 1 739 6 613 8 000 8 540 8 540 8 540 15 814 7 115 7 435 85.2Goods and services 20 968 31 694 23 789 32 239 32 239 32 386 24 629 27 107 28 369 (24.0)Administrative fees %u2013 %u2013 14 50 50 50 50 52 54 0.0Advertising 165 100 100 100 400 400 100 103 108 (75.0)Minor assets %u2013 %u2013 %u2013 500 500 500 %u2013 517 540 (100.0)Audit costs: External %u2013 %u2013 %u2013 %u2013 %u2013 %u2013 %u2013 %u2013 %u2013Bursaries: Employees %u2013 %u2013 100 170 170 170 200 83 87 17.6Catering: Departmental activities %u2013 %u2013 51 %u2013 %u2013 %u2013 %u2013 %u2013 %u2013Communication (G&S) %u2013 %u2013 %u2013 %u2013 %u2013 %u2013 %u2013 %u2013 %u2013Computer services 6 340 6 500 6 381 5 500 6 070 3 965 5 180 5 687 5 943 30.6Consultants: Business and advisory services %u2013 %u2013 %u2013 %u2013 %u2013 %u2013 %u2013 %u2013 %u2013Infrastructure and planning services %u2013 %u2013 %u2013 %u2013 %u2013 %u2013 %u2013 %u2013 %u2013Laboratory services %u2013 %u2013 %u2013 %u2013 %u2013 %u2013 %u2013 %u2013 %u2013Legal services (G&S) %u2013 %u2013 %u2013 %u2013 %u2013 %u2013 %u2013 %u2013 %u2013Science and technological services %u2013 %u2013 %u2013 %u2013 %u2013 %u2013 %u2013 %u2013 %u2013Contractors 1 003 1 000 1 195 500 500 488 600 517 583 23.0Agency and support/outsourced services 56 %u2013 %u2013 %u2013 %u2013 %u2013 %u2013 %u2013 %u2013Entertainment %u2013 %u2013 %u2013 %u2013 %u2013 %u2013 %u2013 %u2013 %u2013Fleet services (including government motor transport) 701 1 000 1 055 1 200 1 200 1 200 1 200 1 326 1 386 0.0Housing %u2013 %u2013 %u2013 %u2013 %u2013 %u2013 %u2013 %u2013 %u2013Inventory: Clothing material and accessories %u2013 %u2013 %u2013 %u2013 %u2013 %u2013 %u2013 %u2013 %u2013Inventory: Farming supplies %u2013 %u2013 %u2013 %u2013 %u2013 %u2013 %u2013 %u2013 %u2013Inventory: Food and food supplies %u2013 %u2013 %u2013 %u2013 %u2013 %u2013 %u2013 %u2013 %u2013Inventory: Fuel, oil and gas %u2013 %u2013 %u2013 %u2013 %u2013 %u2013 %u2013 %u2013 %u2013Inventory: Learner and teacher support material %u2013 %u2013 %u2013 %u2013 %u2013 %u2013 %u2013 %u2013 %u2013Inventory: Materials and supplies 25 %u2013 %u2013 %u2013 200 200 %u2013 %u2013 %u2013 (100.0)Inventory: Medical supplies %u2013 %u2013 %u2013 %u2013 %u2013 %u2013 %u2013 %u2013 %u2013Inventory: Medicine %u2013 %u2013 %u2013 %u2013 %u2013 %u2013 %u2013 %u2013 %u2013Medsas inventory interface %u2013 %u2013 %u2013 %u2013 %u2013 %u2013 %u2013 %u2013 %u2013Inventory: Other supplies 6 621 17 291 7 707 10 100 12 850 10 682 9 761 12 550 13 113 (8.6)Consumable supplies 235 100 %u2013 %u2013 %u2013 %u2013 %u2013 %u2013 %u2013Consumables: Stationery, printing and office supplies 975 900 532 548 1 548 1 548 1 000 567 593 (35.4)Operating leases 2 798 3 000 4 769 10 910 5 510 9 942 3 000 3 102 3 242 (69.8)Rental and hiring 416 %u2013 445 %u2013 %u2013 %u2013 %u2013 155 162Property payments 76 %u2013 %u2013 550 750 750 488 298 311 (34.9)Transport provided: Departmental activity 863 1 103 1 000 %u2013 %u2013 %u2013 400 1 530 1 599Travel and subsistence 659 500 150 1 480 2 180 2 180 1 330 310 324 (39.0)Training and development %u2013 %u2013 %u2013 300 300 300 300 %u2013 %u2013 0.0Operating payments 35 200 290 %u2013 %u2013 %u2013 620 310 324Venues and facilities %u2013 %u2013 %u2013 331 11 11 400 %u2013 %u2013 3536.4Interest and rent on land %u2013 %u2013 %u2013 %u2013 %u2013 %u2013 %u2013 %u2013 %u2013Interest (Incl. interest on unitary payments (PPP)) %u2013 %u2013 %u2013 %u2013 %u2013 %u2013 %u2013 %u2013 %u2013Rent on land %u2013 %u2013 %u2013 %u2013 %u2013 %u2013 %u2013 %u2013 %u2013Transfers and subsidies 48 242 44 765 44 758 44 668 44 668 44 797 44 668 44 668 46 679 (0.3)Provinces and municipalities 42 168 42 168 42 168 42 168 42 168 42 168 42 168 42 168 44 066 0.0Provinces %u2013 %u2013 %u2013 %u2013 %u2013 %u2013 %u2013 %u2013 %u2013Provincial Revenue Funds %u2013 %u2013 %u2013 %u2013 %u2013 %u2013 %u2013 %u2013 %u2013Provincial agencies and funds %u2013 %u2013 %u2013 %u2013 %u2013 %u2013 %u2013 %u2013 %u2013Municipalities 42 168 42 168 42 168 42 168 42 168 42 168 42 168 42 168 44 066 0.0Municipal bank accounts 42 168 42 168 42 168 42 168 42 168 42 168 42 168 42 168 44 066 0.0Municipal agencies and funds %u2013 %u2013 %u2013 %u2013 %u2013 %u2013 %u2013 %u2013 %u2013Departmental agencies and accounts %u2013 %u2013 %u2013 %u2013 %u2013 %u2013 %u2013 %u2013 %u2013Social security funds %u2013 %u2013 %u2013 %u2013 %u2013 %u2013 %u2013 %u2013 %u2013Departmental agencies (non-business entities) %u2013 %u2013 %u2013 %u2013 %u2013 %u2013 %u2013 %u2013 %u2013Higher education institutions %u2013 %u2013 %u2013 %u2013 %u2013 %u2013 %u2013 %u2013 %u2013Foreign governments and international organisations %u2013 %u2013 %u2013 %u2013 %u2013 %u2013 %u2013 %u2013 %u2013Public corporations and private enterprises %u2013 %u2013 %u2013 %u2013 %u2013 %u2013 %u2013 %u2013 %u2013Public corporations %u2013 %u2013 %u2013 %u2013 %u2013 %u2013 %u2013 %u2013 %u2013Subsidies on products and production (pc) %u2013 %u2013 %u2013 %u2013 %u2013 %u2013 %u2013 %u2013 %u2013Other transfers to public corporations %u2013 %u2013 %u2013 %u2013 %u2013 %u2013 %u2013 %u2013 %u2013Private enterprises %u2013 %u2013 %u2013 %u2013 %u2013 %u2013 %u2013 %u2013 %u2013Subsidies on products and production (pe) %u2013 %u2013 %u2013 %u2013 %u2013 %u2013 %u2013 %u2013 %u2013Other transfers to private enterprises %u2013 %u2013 %u2013 %u2013 %u2013 %u2013 %u2013 %u2013 %u2013Non-profit institutions 2 000 2 500 2 500 2 500 2 500 2 500 2 500 2 500 2 613 0.0Households 4 074 97 90 %u2013 %u2013 129 %u2013 %u2013 %u2013 (100.0)Social benefits 4 074 97 90 %u2013 %u2013 129 %u2013 %u2013 %u2013 (100.0)Other transfers to households %u2013 %u2013 %u2013 %u2013 %u2013 %u2013 %u2013 %u2013 %u2013Payments for capital assets 34 708 34 592 13 996 20 964 37 815 37 814 15 061 15 959 16 677 (60.2)Buildings and other fixed structures 30 642 33 806 13 096 20 000 36 851 36 851 14 097 14 887 15 557 (61.7)Buildings 30 642 33 806 13 096 20 000 36 851 36 851 14 097 14 887 15 557 (61.7)Other fixed structures %u2013 %u2013 %u2013 %u2013 %u2013 %u2013 %u2013 %u2013 %u2013Machinery and equipment 4 066 786 900 964 964 963 964 1 072 1 120 0.1Transport equipment 4 066 786 900 964 964 962 964 1 072 1 120 0.2Other machinery and equipment %u2013 %u2013 %u2013 %u2013 %u2013 1 %u2013 %u2013 %u2013 (100.0)Heritage Assets %u2013 %u2013 %u2013 %u2013 %u2013 %u2013 %u2013 %u2013 %u2013Specialised military assets %u2013 %u2013 %u2013 %u2013 %u2013 %u2013 %u2013 %u2013 %u2013Biological assets %u2013 %u2013 %u2013 %u2013 %u2013 %u2013 %u2013 %u2013 %u2013Land and sub-soil assets %u2013 %u2013 %u2013 %u2013 %u2013 %u2013 %u2013 %u2013 %u2013Software and other intangible assets %u2013 %u2013 %u2013 %u2013 %u2013 %u2013 %u2013 %u2013 %u2013Payments for financial assets %u2013 %u2013 %u2013 %u2013 %u2013 %u2013 %u2013 %u2013 %u2013Total economic classification 161 809 175 376 165 881 182 156 199 007 199 007 187 261 195 804 204 873 (5.9)2024/25848
