
Page 476 - Provincial Treasury Estimates.pdf
P. 476
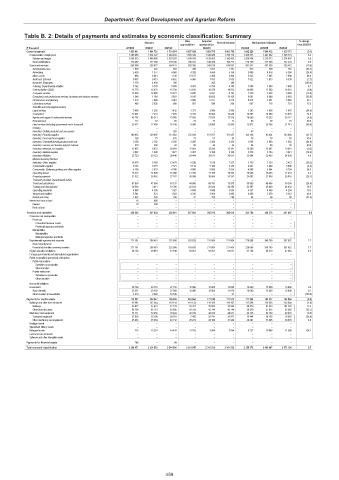
Department: Rural Development and Agrarian Reform
Table B. 2: Details of payments and estimates by economic classification: Summary
Outcome Main Adjusted Revised estimate Medium-term estimates % change
appropriation appropriation from 2022/23
R thousand 2019/20 2020/21 2021/22 2022/23 2023/24 2024/25 2025/26
Current payments 1 835 901 1 664 703 1 718 874 1 897 699 1 883 705 1 883 709 1 882 220 1 849 432 1 935 173 (0.1)
Compensation of employees 1 269 495 1 234 327 1 249 443 1 395 349 1 336 889 1 336 712 1 420 573 1 441 882 1 506 731 6.3
Salaries and wages 1 093 013 1 056 558 1 070 203 1 190 018 1 138 453 1 142 435 1 209 834 1 219 773 1 274 407 5.9
Social contributions 176 482 177 769 179 240 205 331 198 436 194 277 210 739 222 109 232 324 8.5
Goods and services 566 388 429 877 469 431 502 350 546 816 546 997 461 647 407 550 428 442 (15.6)
Administrative fees 1 593 202 384 269 1 227 1 401 513 708 740 (63.4)
Advertising 5 403 1 377 4 960 4 328 4 560 5 159 3 899 4 078 4 266 (24.4)
Minor assets 966 6 041 1 310 15 617 3 466 3 460 5 832 7 645 7 998 68.6
Audit cost: External 6 857 5 013 6 452 6 960 7 833 7 833 7 622 7 973 8 339 (2.7)
Bursaries: Employees 1 179 4 050 336 – 262 286 – – – (100.0)
Catering: Departmental activities 8 742 5 778 9 689 4 479 6 780 6 783 7 099 7 349 7 688 4.7
Communication (G&S) 15 779 15 025 15 764 13 610 16 076 16 074 14 686 17 580 18 516 (8.6)
Computer services 15 883 12 690 10 374 9 825 9 031 8 794 7 579 5 338 5 583 (13.8)
Consultants and professional services: Business and advisory services 1 348 1 193 3 870 9 016 10 825 10 160 6 601 6 688 6 963 (35.0)
Infrastructure and planning 1 479 7 689 4 061 3 082 5 217 5 214 6 973 5 321 5 048 33.7
Laboratory services 468 2 526 880 657 596 596 687 718 751 15.3
Scientific and technological services – – – – – – – – –
Legal services 3 498 1 205 1 412 1 373 2 984 2 984 1 345 1 405 1 470 (54.9)
Contractors 16 001 2 331 7 925 8 254 10 654 10 649 18 587 14 599 13 825 74.5
Agency and support / outsourced services 45 707 65 211 73 585 77 835 72 915 72 915 70 000 19 232 20 117 (4.0)
Entertainment 117 57 69 72 74 74 89 90 94 20.3
Fleet services (including government motor transport) 23 477 17 493 16 148 8 895 24 950 23 998 12 812 20 786 21 741 (46.6)
Housing – – – – – – – – –
Inventory: Clothing material and accessories – – 220 – – – 67 – –
Inventory: Farming supplies 166 935 129 697 113 663 152 938 151 057 151 057 103 106 93 434 103 888 (31.7)
Inventory: Food and food supplies 126 75 435 73 53 53 76 79 83 43.4
Inventory: Chemicals,fuel,oil,gas,wood and coal 2 156 2 752 2 335 2 285 2 284 2 320 1 068 1 800 1 882 (54.0)
Inventory: Learner and teacher support material 378 293 42 86 44 44 84 86 90 90.9
Inventory: Materials and supplies 12 957 5 072 20 584 17 961 15 290 15 291 15 259 15 097 13 931 (0.2)
Inventory: Medical supplies 2 567 1 028 1 877 2 461 3 160 3 160 2 578 3 194 3 341 (18.4)
Inventory: Medicine 32 753 29 123 28 440 29 444 30 611 30 611 32 084 33 403 34 939 4.8
Medsas inventory interface – – – – – – – – –
Inventory: Other supplies 16 078 5 168 13 479 6 296 7 516 7 527 3 150 3 320 3 472 (58.2)
Consumable supplies 9 167 8 375 7 571 5 114 5 104 5 145 4 921 5 449 5 698 (4.4)
Consumable: Stationery,printing and office supplies 5 199 3 923 4 286 4 965 3 685 3 634 4 888 5 004 5 234 34.5
Operating leases 15 212 14 609 15 080 13 918 17 166 16 252 16 946 16 458 17 214 4.3
Property payments 21 522 25 092 27 167 26 599 35 580 34 297 24 667 27 646 28 918 (28.1)
Transport provided: Departmental activity – – – – – – – – –
Travel and subsistence 97 934 47 966 63 137 44 856 69 791 73 975 55 955 48 406 50 356 (24.4)
Training and development 19 536 3 611 10 790 22 832 20 820 20 258 23 597 25 460 26 632 16.5
Operating payments 4 968 4 308 1 027 3 888 3 846 3 634 4 337 4 069 4 254 19.3
Venues and facilities 8 541 521 1 823 4 310 3 060 3 060 4 486 5 079 5 312 46.6
Rental and hiring 1 862 383 256 52 299 299 54 56 59 (81.9)
Interest and rent on land 18 499 – – – – – – –
Interest 18 499 – – – – – – –
Rent on land – – – – – – – – –
Transfers and subsidies 358 569 347 033 330 961 257 684 285 915 285 915 304 796 428 278 441 067 6.6
Provinces and municipalities – – – – – – – – –
Provinces – – – – – – – – –
Provincial Revenue Funds – – – – – – – – –
Provincial agencies and funds – – – – – – – – –
Municipalities – – – – – – – – –
Municipalities – – – – – – – – –
Municipal agencies and funds – – – – – – – – –
Departmental agencies and accounts 271 101 256 481 232 608 183 633 211 864 211 864 228 088 348 799 357 932 7.7
Social security funds – – – – – – – – –
Provide list of entities receiving transfers 271 101 256 481 232 608 183 633 211 864 211 864 228 088 348 799 357 932 7.7
Higher education institutions 58 704 59 801 61 198 59 051 59 051 59 051 61 708 64 479 67 445 4.5
Foreign governments and international organisations – – – – – – – – –
Public corporations and private enterprises – – – – – – – – –
Public corporations – – – – – – – – –
Subsidies on production – – – – – – – – –
Other transfers – – – – – – – – –
Private enterprises – – – – – – – – –
Subsidies on production – – – – – – – – –
Other transfers – – – – – – – – –
Non-profit institutions – – – – – – – – –
Households 28 764 30 751 37 155 15 000 15 000 15 000 15 000 15 000 15 690 0.0
Social benefits 25 251 28 403 27 009 15 000 15 000 14 979 15 000 15 000 15 690 0.1
Other transfers to households 3 513 2 348 10 146 – – 21 – – – (100.0)
Payments for capital assets 173 207 222 847 195 026 163 564 171 910 171 912 171 360 182 377 194 864 (0.3)
Buildings and other fixed structures 99 981 137 344 110 114 119 133 119 106 119 107 117 898 119 338 133 804 (1.0)
Buildings 33 877 41 631 47 179 76 374 76 362 76 363 89 579 91 523 101 422 17.3
Other fixed structures 66 104 95 713 62 935 42 759 42 744 42 744 28 319 27 815 32 382 (33.7)
Machinery and equipment 73 111 70 252 70 493 32 729 48 910 48 911 44 735 52 150 49 672 (8.5)
Transport equipment 27 628 35 198 29 781 7 455 20 741 20 971 15 444 18 155 18 993 (26.4)
Other machinery and equipment 45 483 35 054 40 712 25 274 28 169 27 940 29 291 33 995 30 679 4.8
Heritage Assets – – – – – – – – –
Specialised military assets – – – – – – – – –
Biological assets 115 15 251 14 419 11 702 3 894 3 894 8 727 10 889 11 388 124.1
Land and sub-soil assets – – – – – – – – –
Software and other intangible assets – – – – – – – – –
Payments for financial assets 795 – 59 – – – – – –
Total economic classification 2 368 471 2 234 583 2 244 920 2 318 947 2 341 530 2 341 536 2 358 376 2 460 087 2 571 104 0.7
459