
Page 578 - Provincial Treasury Estimates.pdf
P. 578
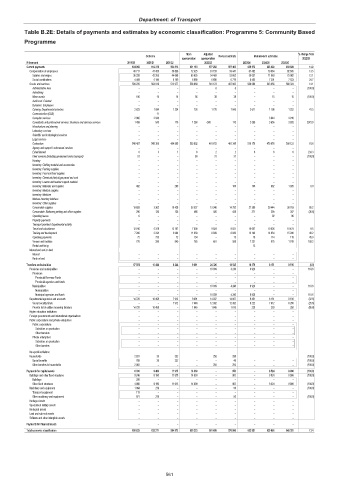
Department: of Transport
Table B.2E: Details of payments and estimates by economic classification: Programme 5: Community Based
Programme
Main Adjusted % change from
Outcome Revised estimate Medium-term estimates
appropriation appropriation 2022/23
R thousand 2019/20 2020/21 2021/22 2022/23 2023/24 2024/25 2025/26
Current payments 634 952 612 378 564 814 631 193 577 282 557 403 635 572 623 020 650 929 14.0
Compensation of employees 40 717 47 459 50 836 72 325 61 159 59 441 67 492 79 064 82 605 13.5
Salaries and wages 36 228 42 265 44 668 65 635 54 469 52 662 59 037 71 863 75 082 12.1
Social contributions 4 489 5 194 6 169 6 690 6 690 6 779 8 455 7 201 7 523 24.7
Goods and services 594 235 564 919 513 977 558 868 516 123 497 962 568 080 543 956 568 324 14.1
Administrative fees – – – – 6 6 – – – (100.0)
Advertising – – – – – – – – –
Minor assets 106 10 14 56 38 38 – 15 15 (100.0)
Audit cost: External – – – – – – – – –
Bursaries: Employees – – – – – – – – –
Catering: Departmental activities 2 623 1 094 1 324 726 1 778 1 845 2 611 1 198 1 252 41.5
Communication (G&S) – 11 – – – – – – –
Computer services 2 866 2 948 – – – – – 3 844 4 016
Consultants and professional services: Business and advisory services 1 459 545 170 1 268 -380 115 2 500 3 656 3 820 2073.9
Infrastructure and planning – – – – – – – – –
Laboratory services – – – – – – – – –
Scientific and technological services – – – – – – – – –
Legal services – – – – – – – – –
Contractors 546 487 548 308 484 905 503 002 481 613 461 345 510 170 478 676 500 121 10.6
Agency and support / outsourced services – – – – – – – – –
Entertainment 6 3 1 6 2 2 6 6 6 233.3
Fleet services (including government motor transport) 51 – – 60 31 31 – – – (100.0)
Housing – – – – – – – – –
Inventory: Clothing material and accessories – – – – – – – – –
Inventory: Farming supplies – – – – – – – – –
Inventory: Food and food supplies – – – – – – – – –
Inventory: Chemicals,fuel,oil,gas,wood and coal – – – – – – – – –
Inventory: Learner and teacher support material – – – – – – – – –
Inventory: Materials and supplies 492 – 289 – – 100 100 982 1 026 0.0
Inventory: Medical supplies – – – – – – – – –
Inventory: Medicine – – – – – – – – –
Medsas inventory interface – – – – – – – – –
Inventory: Other supplies – – – – – – – – –
Consumable supplies 19 693 3 302 10 428 33 527 13 346 14 792 27 399 29 444 30 763 85.2
Consumable: Stationery,printing and office supplies 296 136 136 486 426 428 271 294 307 (36.6)
Operating leases 6 – – – – – – 92 96
Property payments – – – – – – – – –
Transport provided: Departmental activity – – – – – – – – –
Travel and subsistence 12 016 5 319 12 107 7 800 9 824 9 821 10 657 10 026 10 474 8.5
Training and development 7 286 2 224 3 684 11 039 8 839 8 839 13 103 14 634 15 290 48.2
Operating payments 72 733 72 134 – 13 19 114 119 45.0
Venues and facilities 776 286 849 765 601 588 1 231 975 1 019 109.2
Rental and hiring – – – – – – 13 – –
Interest and rent on land – – – – – – – – –
Interest – – – – – – – – –
Rent on land – – – – – – – – –
Transfers and subsidies 17 551 10 484 8 244 9 091 24 326 18 545 18 379 8 151 8 516 (0.9)
Provinces and municipalities – – – – 10 039 4 240 8 928 – – 110.6
Provinces – – – – – – – – –
Provincial Revenue Funds – – – – – – – – –
Provincial agencies and funds – – – – – – – – –
Municipalities – – – – 10 039 4 240 8 928 – – 110.6
Municipalities – – – – – – – – –
Municipal agencies and funds – – – – 10 039 4 240 8 928 – – 110.6
Departmental agencies and accounts 14 720 10 458 7 912 9 091 14 037 14 007 9 451 8 151 8 516 (32.5)
Social security funds – – 7 912 7 446 12 392 12 392 9 222 7 912 8 266 (25.6)
Provide list of entities receiving transfers 14 720 10 458 – 1 645 1 645 1 615 229 239 250 (85.8)
Higher education institutions – – – – – – – – –
Foreign governments and international organisations – – – – – – – – –
Public corporations and private enterprises – – – – – – – – –
Public corporations – – – – – – – – –
Subsidies on production – – – – – – – – –
Other transfers – – – – – – – – –
Private enterprises – – – – – – – – –
Subsidies on production – – – – – – – – –
Other transfers – – – – – – – – –
Non-profit institutions – – – – – – – – –
Households 2 831 26 332 – 250 298 – – – (100.0)
Social benefits 769 26 332 – – 48 – – – (100.0)
Other transfers to households 2 062 – – – 250 250 – – – (100.0)
Payments for capital assets 6 330 9 409 11 915 14 939 – 953 – 8 524 8 906 (100.0)
Buildings and other fixed structures 5 246 9 190 11 915 14 939 – 903 – 8 524 8 906 (100.0)
Buildings 280 – – – – – – – –
Other fixed structures 4 966 9 190 11 915 14 939 – 903 – 8 524 8 906 (100.0)
Machinery and equipment 1 084 219 – – – 50 – – – (100.0)
Transport equipment 113 – – – – – – – –
Other machinery and equipment 971 219 – – – 50 – – – (100.0)
Heritage Assets – – – – – – – – –
Specialised military assets – – – – – – – – –
Biological assets – – – – – – – – –
Land and sub-soil assets – – – – – – – – –
Software and other intangible assets – – – – – – – – –
Payments for financial assets – – – – – – – – –
Total economic classification 658 833 632 271 584 973 655 223 601 608 576 900 653 951 639 695 668 351 13.4
561