
Page 573 - Provincial Treasury Estimates.pdf
P. 573
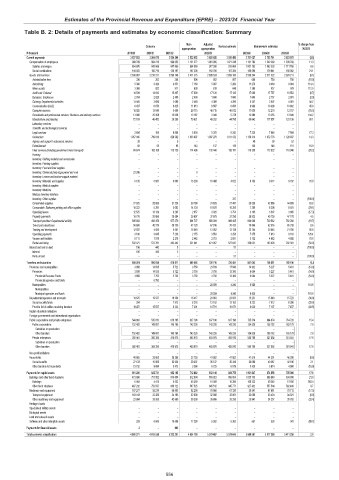
Estimates of the Provincial Revenue and Expenditure (EPRE) – 2023/24 Financial Year
Table B. 2: Details of payments and estimates by economic classification: Summary
Main Adjusted % change from
Outcome Revised estimate Medium-term estimates
appropriation appropriation 2022/23
R thousand 2019/20 2020/21 2021/22 2022/23 2023/24 2024/25 2025/26
Current payments 3 637 802 3 204 870 3 594 206 3 532 652 3 920 628 3 930 459 3 791 027 3 753 791 3 923 979 (3.5)
Compensation of employees 998 709 994 216 998 053 1 121 277 1 081 095 1 071 248 1 191 783 1 242 269 1 299 768 11.3
Salaries and wages 854 676 843 506 847 855 954 069 917 388 913 864 1 001 193 1 062 328 1 111 766 9.6
Social contributions 144 033 150 710 150 197 167 208 163 706 157 384 190 590 179 941 188 002 21.1
Goods and services 2 638 897 2 210 211 2 596 148 2 411 375 2 839 533 2 859 160 2 599 244 2 511 522 2 624 211 (9.1)
Administrative fees 336 263 248 506 802 807 686 754 788 (15.0)
Advertising 5 398 3 420 4 851 7 189 5 087 5 260 11 278 9 480 9 904 114.4
Minor assets 3 368 822 911 638 819 648 1 380 937 978 112.9
Audit cost: External 14 539 14 633 15 407 17 000 17 120 17 120 17 000 17 757 18 553 (0.7)
Bursaries: Employees 2 764 2 028 2 409 2 400 1 690 1 690 1 640 2 757 2 881 (3.0)
Catering: Departmental activities 13 405 2 696 3 090 2 469 4 389 4 289 6 357 3 907 4 081 48.2
Communication (G&S) 8 437 6 678 6 825 11 913 9 567 6 856 9 998 10 396 10 862 45.8
Computer services 10 925 13 049 5 608 29 715 46 715 46 872 11 038 12 210 12 757 (76.5)
Consultants and professional services: Business and advisory services 13 980 25 458 15 038 13 187 3 449 5 278 12 889 13 255 13 849 144.2
Infrastructure and planning 72 109 46 452 26 388 70 621 48 332 44 785 80 642 117 857 123 136 80.1
Laboratory services – – – – – – – – –
Scientific and technological services – – – – – – – – –
Legal services 3 854 108 9 588 5 034 5 378 6 242 7 320 7 646 7 989 17.3
Contractors 1 057 045 799 816 826 562 1 033 097 1 097 278 1 011 472 1 156 314 1 072 776 1 120 837 14.3
Agency and support / outsourced services 28 – 6 – – – 48 50 52
Entertainment 68 55 95 143 137 118 138 146 151 16.9
Fleet services (including government motor transport) 84 674 105 109 115 720 114 496 132 440 138 187 110 338 112 822 118 046 (20.2)
Housing – – – – – – – – –
Inventory: Clothing material and accessories – – – – – – – – –
Inventory: Farming supplies – – – – – – – – –
Inventory: Food and food supplies – – – – – – – – –
Inventory: Chemicals,fuel,oil,gas,wood and coal 23 296 – – 0 – – – – –
Inventory: Learner and teacher support material – – – – – – – – –
Inventory: Materials and supplies 5 126 5 581 6 009 15 238 16 488 4 622 8 133 9 377 9 797 76.0
Inventory: Medical supplies – – – – – – – – –
Inventory: Medicine – – – – – – – – –
Medsas inventory interface – – – – – – – – –
Inventory: Other supplies – – – – – 337 – – – (100.0)
Consumable supplies 27 925 28 080 31 226 50 788 31 629 27 497 50 530 42 886 44 809 83.8
Consumable: Stationery,printing and office supplies 10 222 5 291 3 662 14 124 10 670 10 259 7 269 8 208 8 575 (29.1)
Operating leases 12 525 13 139 8 285 2 657 3 025 3 754 3 105 3 507 3 665 (17.3)
Property payments 19 776 20 866 28 594 35 697 37 879 37 256 38 923 45 730 47 778 4.5
Transport provided: Departmental activity 605 803 493 359 977 379 694 727 858 309 869 485 698 080 729 582 762 268 (19.7)
Travel and subsistence 86 600 40 319 59 730 47 129 67 916 70 412 70 846 62 516 65 319 0.6
Training and development 12 922 4 585 6 561 16 049 13 052 12 128 23 744 20 845 21 780 95.8
Operating payments 3 190 3 645 7 238 2 175 3 553 3 258 7 375 7 813 8 163 126.4
Venues and facilities 8 111 1 978 2 278 2 442 2 753 2 881 5 152 4 682 4 892 78.8
Rental and hiring 532 471 572 781 432 442 221 941 421 057 527 647 259 021 193 626 202 301 (50.9)
Interest and rent on land 196 443 5 – – 51 – – – (100.0)
Interest 196 443 5 – – – – – –
Rent on land – – – – – 51 – – – (100.0)
Transfers and subsidies 609 261 590 938 676 517 689 066 726 710 720 431 807 013 748 651 782 190 12.0
Provinces and municipalities 3 858 14 535 5 722 3 750 23 789 17 540 14 932 5 227 5 461 (14.9)
Provinces 3 858 14 535 5 722 3 750 3 750 13 300 6 004 5 227 5 461 (54.9)
Provincial Revenue Funds 3 858 7 752 5 722 3 750 3 750 13 300 6 004 5 227 5 461 (54.9)
Provincial agencies and funds – 6 783 – – – – – – –
Municipalities – – – – 20 039 4 240 8 928 – – 110.6
Municipalities – – – – – – – – –
Municipal agencies and funds – – – – 20 039 4 240 8 928 – – 110.6
Departmental agencies and accounts 19 676 15 527 16 234 15 417 23 863 23 833 15 251 15 049 15 723 (36.0)
Social security funds 204 – 7 912 8 216 13 162 13 162 9 222 7 912 8 266 (29.9)
Provide list of entities receiving transfers 19 472 15 527 8 322 7 201 10 701 10 671 6 029 7 137 7 457 (43.5)
Higher education institutions – – – – – – – – –
Foreign governments and international organisations – – – – – – – – –
Public corporations and private enterprises 544 863 535 013 616 165 637 196 637 196 637 196 735 314 684 074 714 720 15.4
Public corporations 152 402 149 657 145 190 143 226 143 226 143 226 154 528 156 182 163 179 7.9
Subsidies on production – – – – – – – – –
Other transfers 152 402 149 657 145 190 143 226 143 226 143 226 154 528 156 182 163 179 7.9
Private enterprises 392 461 385 356 470 975 493 970 493 970 493 970 580 786 527 892 551 541 17.6
Subsidies on production – – – – – – – – –
Other transfers 392 461 385 356 470 975 493 970 493 970 493 970 580 786 527 892 551 541 17.6
Non-profit institutions – – – – – – – – –
Households 40 865 25 863 38 396 32 703 41 862 41 862 41 516 44 301 46 286 (0.8)
Social benefits 27 133 15 969 32 924 29 307 35 137 35 343 36 096 40 387 42 196 2.1
Other transfers to households 13 732 9 894 5 473 3 396 6 725 6 519 5 420 3 914 4 090 (16.9)
Payments for capital assets 661 206 822 731 952 105 712 402 932 149 928 755 1 091 847 674 856 705 090 17.6
Buildings and other fixed structures 473 696 757 952 874 654 612 894 855 921 856 054 1 035 755 606 849 634 036 21.0
Buildings 6 464 4 415 6 532 45 369 10 409 10 284 108 323 49 345 51 556 953.4
Other fixed structures 467 232 753 537 868 122 567 525 845 512 845 771 927 432 557 504 582 480 9.7
Machinery and equipment 187 277 58 274 66 883 82 209 70 866 67 338 55 541 67 681 70 713 (17.5)
Transport equipment 163 413 22 339 24 195 32 000 32 000 32 001 32 000 33 424 34 921 (0.0)
Other machinery and equipment 23 864 35 935 42 688 50 209 38 866 35 338 23 541 34 257 35 792 (33.4)
Heritage Assets – – – – – – – – –
Specialised military assets – – – – – – – – –
Biological assets – – – – – – – – –
Land and sub-soil assets – – – – – – – – –
Software and other intangible assets 233 6 505 10 568 17 299 5 362 5 362 551 326 341 (89.7)
Payments for financial assets 2 – 463 – – – – – –
Total economic classification 4 908 271 4 618 538 5 223 291 4 934 120 5 579 487 5 579 645 5 689 887 5 177 298 5 411 259 2.0
556