
Page 576 - Provincial Treasury Estimates.pdf
P. 576
Department: of Transport
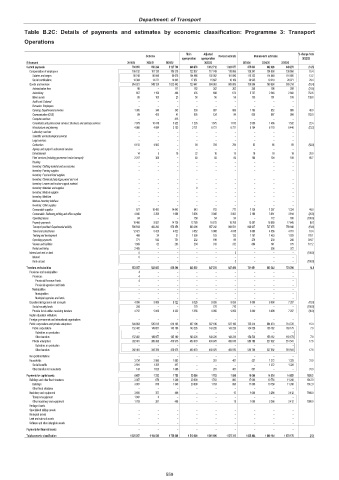
Table B.2C: Details of payments and estimates by economic classification: Programme 3: Transport
Operations
Main Adjusted % change from
Outcome Revised estimate Medium-term estimates
appropriation appropriation 2022/23
R thousand 2019/20 2020/21 2021/22 2022/23 2023/24 2024/25 2025/26
Current payments 760 053 650 244 1 127 760 846 478 1 012 712 1 023 877 875 833 902 926 940 270 (14.5)
Compensation of employees 105 132 101 120 105 318 122 837 117 749 118 065 136 247 134 058 136 956 15.4
Salaries and wages 90 748 86 849 90 676 104 986 102 052 101 896 115 322 114 848 116 885 13.2
Social contributions 14 384 14 271 14 643 17 851 15 697 16 169 20 925 19 210 20 071 29.4
Goods and services 654 921 549 124 1 022 442 723 641 894 963 905 809 739 586 768 868 803 314 (18.4)
Administrative fees 98 – 117 182 362 362 248 198 208 (31.5)
Advertising 657 1 156 466 435 698 673 5 737 2 546 2 660 752.6
Minor assets 88 105 23 58 56 56 135 181 189 139.8
Audit cost: External – – – – – – – – –
Bursaries: Employees – – – – – – – – –
Catering: Departmental activities 1 305 346 342 530 807 806 1 193 852 889 48.0
Communication (G&S) 99 455 41 905 124 94 830 867 906 783.9
Computer services – – 415 – – – – – –
Consultants and professional services: Business and advisory services 7 979 16 478 5 322 1 235 1 675 1 675 2 050 1 466 1 532 22.4
Infrastructure and planning 4 060 4 084 3 153 3 721 6 721 6 721 5 164 6 170 6 446 (23.2)
Laboratory services – – – – – – – – –
Scientific and technological services – – – – – – – – –
Legal services – – – – – – – – –
Contractors 6 153 4 503 – 84 784 784 63 66 69 (92.0)
Agency and support / outsourced services – – – – – – – – –
Entertainment 14 5 16 22 16 15 18 18 18 20.0
Fleet services (including government motor transport) 2 317 369 – 60 60 60 100 104 109 66.7
Housing – – – – – – – – –
Inventory: Clothing material and accessories – – – – – – – – –
Inventory: Farming supplies – – – – – – – – –
Inventory: Food and food supplies – – – – – – – – –
Inventory: Chemicals,fuel,oil,gas,wood and coal – – – – – – – – –
Inventory: Learner and teacher support material – – – – – – – – –
Inventory: Materials and supplies – – – 0 – – – – –
Inventory: Medical supplies – – – – – – – – –
Inventory: Medicine – – – – – – – – –
Medsas inventory interface – – – – – – – – –
Inventory: Other supplies – – – – – – – – –
Consumable supplies 577 10 493 14 643 943 813 777 1 126 1 267 1 324 44.9
Consumable: Stationery,printing and office supplies 4 845 2 208 1 666 3 605 3 040 3 002 2 198 3 651 3 814 (26.8)
Operating leases 84 – – 158 54 54 – 172 180 (100.0)
Property payments 10 466 9 557 14 726 12 789 16 813 16 708 15 587 16 889 17 645 (6.7)
Transport provided: Departmental activity 598 544 493 292 976 456 693 396 857 242 868 531 696 937 727 075 759 648 (19.8)
Travel and subsistence 12 421 5 425 4 022 3 552 5 088 4 978 5 893 4 556 4 761 18.4
Training and development 469 24 31 1 500 103 133 1 167 1 463 1 529 778.1
Operating payments 771 542 751 232 196 69 276 230 240 301.7
Venues and facilities 1 569 82 253 234 313 312 864 741 775 177.2
Rental and hiring 2 405 – – – – – – 356 372
Interest and rent on land 0 – – – – 3 – – – (100.0)
Interest 0 – – – – – – – –
Rent on land – – – – – 3 – – – (100.0)
Transfers and subsidies 553 557 543 062 626 290 643 522 647 223 647 430 741 651 692 244 723 256 14.6
Provinces and municipalities 4 – – – – – – – –
Provinces 4 – – – – – – – –
Provincial Revenue Funds 4 – – – – – – – –
Provincial agencies and funds – – – – – – – – –
Municipalities – – – – – – – – –
Municipalities – – – – – – – – –
Municipal agencies and funds – – – – – – – – –
Departmental agencies and accounts 4 956 5 069 8 322 6 326 9 826 9 826 5 800 6 898 7 207 (41.0)
Social security funds 204 – – 770 770 770 – – – (100.0)
Provide list of entities receiving transfers 4 752 5 069 8 322 5 556 9 056 9 056 5 800 6 898 7 207 (36.0)
Higher education institutions – – – – – – – – –
Foreign governments and international organisations – – – – – – – – –
Public corporations and private enterprises 544 863 535 013 616 165 637 196 637 196 637 196 735 314 684 074 714 720 15.4
Public corporations 152 402 149 657 145 190 143 226 143 226 143 226 154 528 156 182 163 179 7.9
Subsidies on production – – – – – – – – –
Other transfers 152 402 149 657 145 190 143 226 143 226 143 226 154 528 156 182 163 179 7.9
Private enterprises 392 461 385 356 470 975 493 970 493 970 493 970 580 786 527 892 551 541 17.6
Subsidies on production – – – – – – – – –
Other transfers 392 461 385 356 470 975 493 970 493 970 493 970 580 786 527 892 551 541 17.6
Non-profit institutions – – – – – – – – –
Households 3 734 2 980 1 803 – 201 407 537 1 272 1 329 31.9
Social benefits 3 591 1 355 417 – – – – 1 272 1 329
Other transfers to households 143 1 625 1 386 – 201 407 537 – – 31.9
Payments for capital assets 6 657 1 233 1 755 20 000 1 763 1 006 18 000 14 024 14 652 1690.2
Buildings and other fixed structures 3 007 876 1 349 20 000 1 763 993 17 000 10 758 11 240 1612.0
Buildings 3 007 876 1 349 20 000 1 763 993 17 000 10 758 11 240 1612.0
Other fixed structures – – – – – – – – –
Machinery and equipment 3 650 357 406 – – 13 1 000 3 266 3 412 7900.0
Transport equipment 1 947 0 – – – – – – –
Other machinery and equipment 1 703 357 406 – – 13 1 000 3 266 3 412 7900.0
Heritage Assets – – – – – – – – –
Specialised military assets – – – – – – – – –
Biological assets – – – – – – – – –
Land and sub-soil assets – – – – – – – – –
Software and other intangible assets – – – – – – – – –
Payments for financial assets – – – – – – – – –
Total economic classification 1 320 267 1 194 539 1 755 806 1 510 000 1 661 698 1 672 312 1 635 484 1 609 194 1 678 178 (2.2)
559