Page 574 - Provincial Treasury Estimates.pdf
P. 574

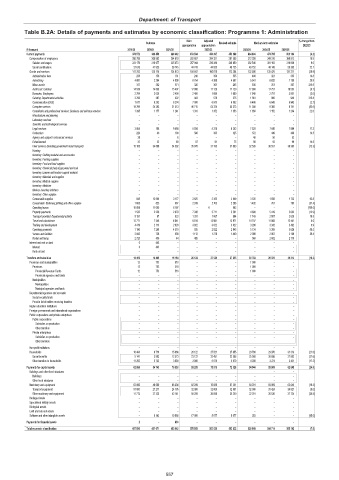
Department: of Transport
           Table B.2A: Details of payments and estimates by economic classification: Programme 1: Administration

                                                                    Main   Adjusted                         % change from
                                                      Outcome                   Revised estimate  Medium-term estimates
                                                                   appropriation  appropriation              2022/23
            R thousand                         2019/20  2020/21  2021/22   2022/23      2023/24  2024/25  2025/26
            Current payments                                  378 572                 386 459                 389 492                 453 534                 450 397                 453 849                 434 804                 474 785                 501 184  (4.2)
             Compensation of employees                        260 789                 260 902                 264 619                 302 687                 284 321                 281 585                 312 298                 349 310                 369 913  10.9
              Salaries and wages                              223 179                 218 977                 225 873                 257 944                 239 388                 240 850                 262 546                 301 162                 319 608  9.0
              Social contributions                              37 610                   41 925                   38 745                   44 743                   44 933                   40 735                   49 752                   48 148                   50 305  22.1
             Goods and services                               117 783                 125 114                 124 873                 150 847                 166 076                 172 264                 122 506                 125 475                 131 271  (28.9)
              Administrative fees                  238   159    131    240    350   355    408    321    335   14.8
              Advertising                                         4 687                     2 264                     4 090                     6 754                     4 389                     4 587                     5 541                     6 832                     7 138  20.8
              Minor assets                         317   382    571    326    301   265    836    351    367   215.9
              Audit cost: External                              14 539                   14 633                   15 407                   17 000                   17 120                   17 120                   17 000                   17 757                   18 553  (0.7)
              Bursaries: Employees                                2 764                     2 028                     2 409                     2 400                     1 690                     1 690                     1 640                     2 757                     2 881  (3.0)
              Catering: Departmental activities                      3 766  387  322  483  579  375                     1 561  900  940  315.8
              Communication (G&S)                                 7 677                     6 202                     6 274                     7 000                     6 913                     6 582                     6 406                     6 645                     6 943  (2.7)
              Computer services                                 19 789                   24 393                   21 313                   46 715                   63 374                   63 373                   11 038                     8 366                     8 741  (82.6)
              Consultants and professional services: Business and advisory services                      1 395                     1 177                     1 241                     1 331                     1 352                     1 353                     1 650                     1 152                     1 204  22.0
              Infrastructure and planning          –      –      –      –     –      –      –      –        –
              Laboratory services                  –      –      –      –     –      –      –      –        –
              Scientific and technological services  –    –      –      –     –      –      –      –      –
              Legal services                                      3 854  108                     9 588                     5 034                     5 378                     6 242                     7 320                     7 646                     7 989  17.3
              Contractors                          220    49    109    596    305   325    372    440    460   14.5
              Agency and support / outsourced services  28  –    6      –     –      –      48    50     52
              Entertainment                        33     33     60    87     91     75     86    92     96    14.5
              Fleet services (including government motor transport)                    15 183                   34 698                   34 592                   35 970                   31 195                   37 083                   32 535                   36 557                   38 365  (12.3)
              Housing                              –      –      –      –     –      –      –      –        –
              Inventory: Clothing material and accessories  –  –  –     –     –      –      –      –        –
              Inventory: Farming supplies          –      –      –      –     –      –      –      –        –
              Inventory: Food and food supplies    –      –      –      –     –      –      –      –        –
              Inventory: Chemicals,fuel,oil,gas,wood and coal  –  –  –  –     –      –      –      –      –
              Inventory: Learner and teacher support material  –  –  –  –     –      –      –      –      –
              Inventory: Materials and supplies    –      –      –      –     –      –      –      –        –
              Inventory: Medical supplies          –      –      –      –     –      –      –      –        –
              Inventory: Medicine                  –      –      –      –     –      –      –      –        –
              Medsas inventory interface           –      –      –      –     –      –      –      –        –
              Inventory: Other supplies            –      –      –      –     –      –      –      –        –
              Consumable supplies                  845                   12 604                     3 177                     3 625                     2 355                     2 049                     3 335                     1 658                     1 733  62.8
              Consumable: Stationery,printing and office supplies                      1 683  825  967                     2 249                     2 703                     2 286                     1 432  761  795  (37.4)
              Operating leases                                  10 089                   11 005                     6 197  –  -0  882  –  –  –  (100.0)
              Property payments                                   1 532                     2 229                     2 879                     7 338                     5 711                     5 391                     4 698                     5 419                     5 662  (12.9)
              Transport provided: Departmental activity                      5 191  67  923                     1 331                     1 067  954                     1 143                     2 507                     2 620  19.8
              Travel and subsistence                            12 771                     7 246                     6 641                     6 814                   13 981                   13 971                   14 747                   11 868                   12 401  5.6
              Training and development                            4 419                     2 173                     2 820                     3 022                     3 022                     3 022                     3 200                     3 342                     3 492  5.9
              Operating payments                                  1 196                     1 268                     4 519  935                     2 922                     2 845                     5 134                     5 385                     5 626  80.5
              Venues and facilities                               2 842  728  593                     1 112                     1 278                     1 440                     2 008                     2 067                     2 159  39.4
              Rental and hiring                                   2 725  456  44  485  –  –  368                     2 602                     2 719
             Interest and rent on land             0     443     –      –     –      –      –      –      –
              Interest                             0     443     –      –     –      –      –      –      –
              Rent on land                         –      –      –      –     –      –      –      –        –
            Transfers and subsidies                             16 416                   10 469                   16 184                   26 122                   37 521                   37 655                   30 760                   29 970                   31 313  (18.3)
             Provinces and municipalities          12    753    518     –     –      –                     1 000  –    –
              Provinces                            12    753    518     –     –      –                     1 000  –    –
               Provincial Revenue Funds            12    753    518     –     –      –                     1 000  –    –
               Provincial agencies and funds       –      –      –      –     –      –      –      –        –
              Municipalities                       –      –      –      –     –      –      –      –        –
               Municipalities                      –      –      –      –     –      –      –      –        –
               Municipal agencies and funds        –      –      –      –     –      –      –      –        –
             Departmental agencies and accounts    –      –      –      –     –      –      –      –        –
              Social security funds                –      –      –      –     –      –      –      –        –
              Provide list of entities receiving transfers  –  –  –     –     –      –      –      –      –
             Higher education institutions         –      –      –      –     –      –      –      –        –
             Foreign governments and international organisations  –  –  –  –  –      –      –      –        –
             Public corporations and private enterprises  –  –   –      –     –      –      –      –      –
              Public corporations                  –      –      –      –     –      –      –      –        –
               Subsidies on production             –      –      –      –     –      –      –      –        –
               Other transfers                     –      –      –      –     –      –      –      –      –
              Private enterprises                  –      –      –      –     –      –      –      –      –
               Subsidies on production             –      –      –      –     –      –      –      –      –
               Other transfers                     –      –      –      –     –      –      –      –        –
             Non-profit institutions               –      –      –      –     –      –      –      –        –
             Households                                         16 404                     9 716                   15 666                   26 122                   37 521                   37 655                   29 760                   29 970                   31 313  (21.0)
              Social benefits                                     5 141                     3 983                   12 573                   23 122                   32 451                   32 586                   25 560                   26 696                   27 892  (21.6)
              Other transfers to households                     11 263                     5 733                     3 093                     3 000                     5 070                     5 070                     4 200                     3 274                     3 421  (17.2)
            Payments for capital assets                         62 866                   54 743                   76 903                   99 209                   75 913                   72 328                   54 544                   59 959                   62 645  (24.6)
             Buildings and other fixed structures  –      –      –      –     –      –      –      –        –
              Buildings                            –      –      –      –     –      –      –      –        –
              Other fixed structures               –      –      –      –     –      –      –      –        –
             Machinery and equipment                            62 866                   48 600                   66 336                   82 209                   70 836                   67 251                   54 291                   59 959                   62 645  (19.3)
              Transport equipment                               51 093                   21 277                   24 195                   32 000                   32 000                   32 001                   32 000                   33 424                   34 921  (0.0)
              Other machinery and equipment                     11 773                   27 323                   42 141                   50 209                   38 836                   35 250                   22 291                   26 535                   27 724  (36.8)
             Heritage Assets                       –      –      –      –     –      –      –      –      –
             Specialised military assets           –      –      –      –     –      –      –      –      –
             Biological assets                     –      –      –      –     –      –      –      –      –
             Land and sub-soil assets              –      –      –      –     –      –      –      –      –
             Software and other intangible assets  –     6 143                   10 568                   17 000                     5 077                     5 077  253  –  –  (95.0)
            Payments for financial assets          2      –     463     –     –      –      –      –      –
            Total economic classification                     457 856                 451 671                 483 042                 578 865                 563 831                 563 832                 520 108                 564 714                 595 142  (7.8)


                                                             557
   569   570   571   572   573   574   575   576   577   578   579