
Page 575 - Provincial Treasury Estimates.pdf
P. 575
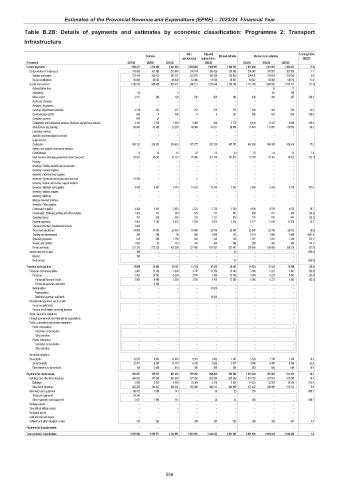
Estimates of the Provincial Revenue and Expenditure (EPRE) – 2023/24 Financial Year
Table B.2B: Details of payments and estimates by economic classification: Programme 2: Transport
Infrastructure
Main Adjusted % change from
Outcome Revised estimate Medium-term estimates
appropriation appropriation 2022/23
R thousand 2019/20 2020/21 2021/22 2022/23 2023/24 2024/25 2025/26
Current payments 1 559 071 1 273 859 1 241 520 1 284 285 1 568 987 1 590 703 1 471 858 1 401 057 1 463 823 (7.5)
Compensation of employees 319 000 307 460 315 949 336 164 336 438 330 486 356 062 370 507 387 106 7.7
Salaries and wages 273 414 260 823 267 121 283 678 285 389 279 929 296 435 314 024 328 092 5.9
Social contributions 45 586 46 637 48 828 52 486 51 048 50 557 59 627 56 483 59 014 17.9
Goods and services 1 239 875 966 399 925 571 948 121 1 232 549 1 260 194 1 115 796 1 030 550 1 076 717 (11.5)
Administrative fees – 16 17
–
–
–
–
–
–
–
–
Advertising 44 102 106
0
–
–
–
Minor assets 2 011 200 126 198 299 164 409 390 407 149.4
–
–
–
–
–
Audit cost: External – –
–
–
Bursaries: Employees – –
–
–
–
–
–
–
–
Catering: Departmental activities 4 278 335 327 253 338 375 536 481 503 42.9
6
6
Communication (G&S) 645 498 157 486 507 529 209.9
4
–
Computer services 614 27 –
–
–
–
–
–
Consultants and professional services: Business and advisory services 3 147 7 258 7 888 8 489 446 1 779 6 144 6 412 6 699 245.4
Infrastructure and planning 68 049 42 368 23 235 66 900 41 611 38 064 75 478 111 687 116 690 98.3
–
–
–
–
–
Laboratory services – –
–
–
–
–
–
Scientific and technological services – –
–
–
–
–
–
–
–
–
–
–
Legal services – –
–
Contractors 503 122 246 253 339 920 527 277 613 338 547 781 642 638 590 385 616 834 17.3
–
–
–
–
–
–
–
Agency and support / outsourced services – –
Entertainment 13 10 15 22 22 20 22 24 25 7.8
Fleet services (including government motor transport) 55 041 70 042 81 127 78 406 101 154 101 013 77 703 76 161 79 572 (23.1)
–
Housing – –
–
–
–
–
–
–
–
–
Inventory: Clothing material and accessories – –
–
–
–
–
–
–
–
–
–
–
Inventory: Farming supplies – –
–
–
–
–
–
–
–
Inventory: Food and food supplies – –
–
–
–
–
–
Inventory: Chemicals,fuel,oil,gas,wood and coal 23 296 –
–
–
–
0
–
Inventory: Learner and teacher support material – –
–
–
–
–
–
–
Inventory: Materials and supplies 4 634 5 581 5 710 15 238 15 758 3 792 7 849 8 203 8 570 107.0
Inventory: Medical supplies – –
–
–
–
–
–
–
–
Inventory: Medicine – –
–
–
–
–
–
–
–
–
–
–
Medsas inventory interface – –
–
–
–
–
–
Inventory: Other supplies – –
–
–
–
–
–
–
Consumable supplies 4 028 1 431 2 463 2 723 3 736 3 500 4 190 4 376 4 572 19.7
Consumable: Stationery,printing and office supplies 1 428 272 249 579 711 641 409 411 429 (36.2)
Operating leases 761 618 455 723 1 127 973 776 810 847 (20.2)
Property payments 1 003 2 197 4 523 5 759 5 835 5 636 6 777 11 034 11 528 20.3
–
–
–
–
–
–
–
Transport provided: Departmental activity 2 068 –
Travel and subsistence 34 956 16 383 25 338 18 696 25 476 28 096 25 680 25 758 26 913 (8.6)
Training and development 748 164 26 489 1 089 135 6 274 1 406 1 469 4547.4
Operating payments 818 908 1 150 632 243 139 1 187 1 291 1 349 752.1
Venues and facilities 1 855 23 123 276 304 284 598 428 448 110.7
Rental and hiring 527 316 572 325 432 398 221 456 421 057 527 647 258 640 190 668 199 210 (51.0)
–
–
–
–
–
–
Interest and rent on land 196 23 – (100.0)
–
–
–
–
–
–
Interest 196 –
–
–
–
–
Rent on land – 23 – (100.0)
–
–
–
Transfers and subsidies 15 658 22 465 20 197 10 331 17 432 16 401 10 533 12 343 12 896 (35.8)
Provinces and municipalities 2 983 13 782 5 204 3 750 13 750 13 300 5 004 5 227 5 461 (62.4)
Provinces 2 983 13 782 5 204 3 750 3 750 13 300 5 004 5 227 5 461 (62.4)
Provincial Revenue Funds 2 983 6 999 5 204 3 750 3 750 13 300 5 004 5 227 5 461 (62.4)
–
–
Provincial agencies and funds – 6 783 –
–
–
–
–
Municipalities – 10 000 –
–
–
–
–
–
–
–
–
–
–
–
–
–
Municipalities – –
–
–
–
–
–
Municipal agencies and funds – 10 000 –
–
–
–
Departmental agencies and accounts – –
–
–
–
–
–
–
–
–
–
–
Social security funds – –
–
–
–
–
–
Provide list of entities receiving transfers – –
–
–
–
–
–
Higher education institutions – –
–
–
–
–
–
–
–
–
–
–
Foreign governments and international organisations – –
–
–
–
–
–
–
–
–
Public corporations and private enterprises – –
–
–
Public corporations – –
–
–
–
–
–
–
–
–
–
–
–
–
–
Subsidies on production – –
–
–
–
–
–
Other transfers – –
–
–
–
–
–
–
–
–
–
–
Private enterprises – –
–
–
–
–
–
–
–
Subsidies on production – –
–
–
–
–
–
Other transfers – –
–
–
–
–
–
–
Non-profit institutions – –
–
–
–
Households 12 675 8 683 14 993 6 581 3 682 3 101 5 529 7 116 7 435 78.3
Social benefits 12 511 6 195 14 115 6 185 2 686 2 517 4 846 6 476 6 766 92.6
Other transfers to households 164 2 488 878 396 996 584 683 640 669 16.9
Payments for capital assets 554 927 756 247 861 235 578 254 854 203 854 199 1 019 303 587 893 614 231 19.3
Buildings and other fixed structures 464 822 747 886 861 093 577 955 853 888 853 888 1 018 755 587 567 613 890 19.3
Buildings 2 556 3 539 4 886 25 369 8 376 9 021 91 323 38 587 40 316 912.4
Other fixed structures 462 266 744 347 856 207 552 586 845 512 844 868 927 432 548 980 573 574 9.8
–
–
Machinery and equipment 89 872 7 999 141 30 25 250 – 889.7
–
–
–
–
–
Transport equipment 84 245 –
–
–
–
Other machinery and equipment 5 627 7 999 141 30 25 250 – 889.7
–
–
–
–
–
–
–
Heritage Assets – –
–
–
Specialised military assets – –
–
–
–
–
–
–
–
Biological assets – –
–
–
–
–
–
–
–
–
–
–
Land and sub-soil assets – –
–
–
–
–
Software and other intangible assets 233 362 299 285 285 298 326 341 4.4
–
–
–
–
–
–
Payments for financial assets – –
–
Total economic classification 2 129 656 2 052 571 2 122 951 1 872 870 2 440 622 2 461 303 2 501 694 2 001 293 2 090 950 1.6
558